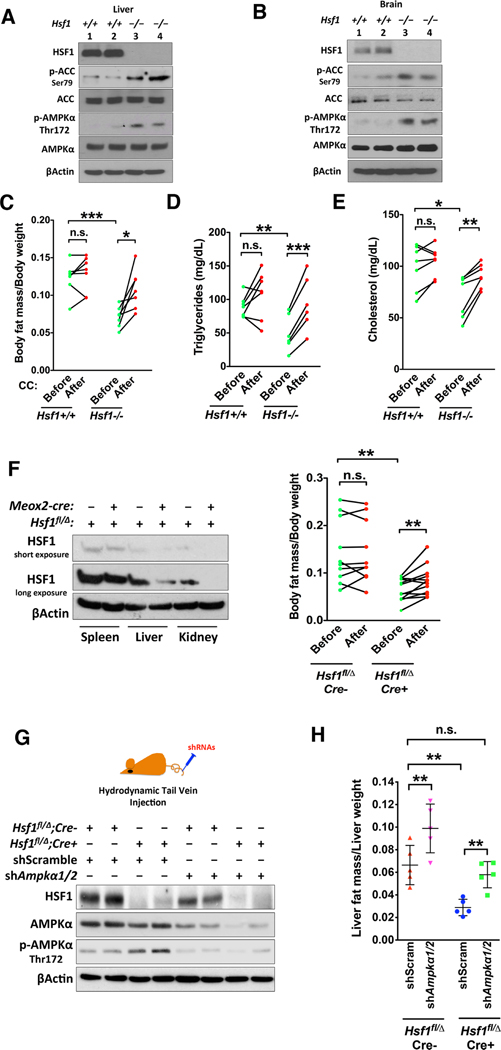
Figure 6: HSF1 controls organismal lipid metabolism via AMPK.
(A and B) Immunoblotting of p-AMPKα in mouse tissues, 2 mice each genotype. (C) NMR body composition analyses of Hsf1+/+ and Hsf1−/− mice before and after i.p. injection of CC (n=7). (D and E) Plasma lipid levels of the same mice described in (C) (n=6 or 7). (F) Immunoblotting of HSF1 in tissues of Hsf1fl/Δ and Meox2-Cre; Hsf1fl/Δ mice (left). NMR body composition analyses of these mice before and after i.p. injection of CC (right, n=10 or 12). (G) Immunoblotting of HSF1 and AMPKα in mouse livers following hydrodynamic injections of scramble or Ampkα1/2-targeting shRNAs, 2 mice each group. (H) NMR composition analyses of livers from mice injected with scramble or Ampkα1/2-targeting shRNAs (n=5).
Error bars are mean±SD, unpaired and paired Student’s t test (C-F, two-tailed) or One-way ANOVA (H). See also Figure S6.

