
Figure 6.
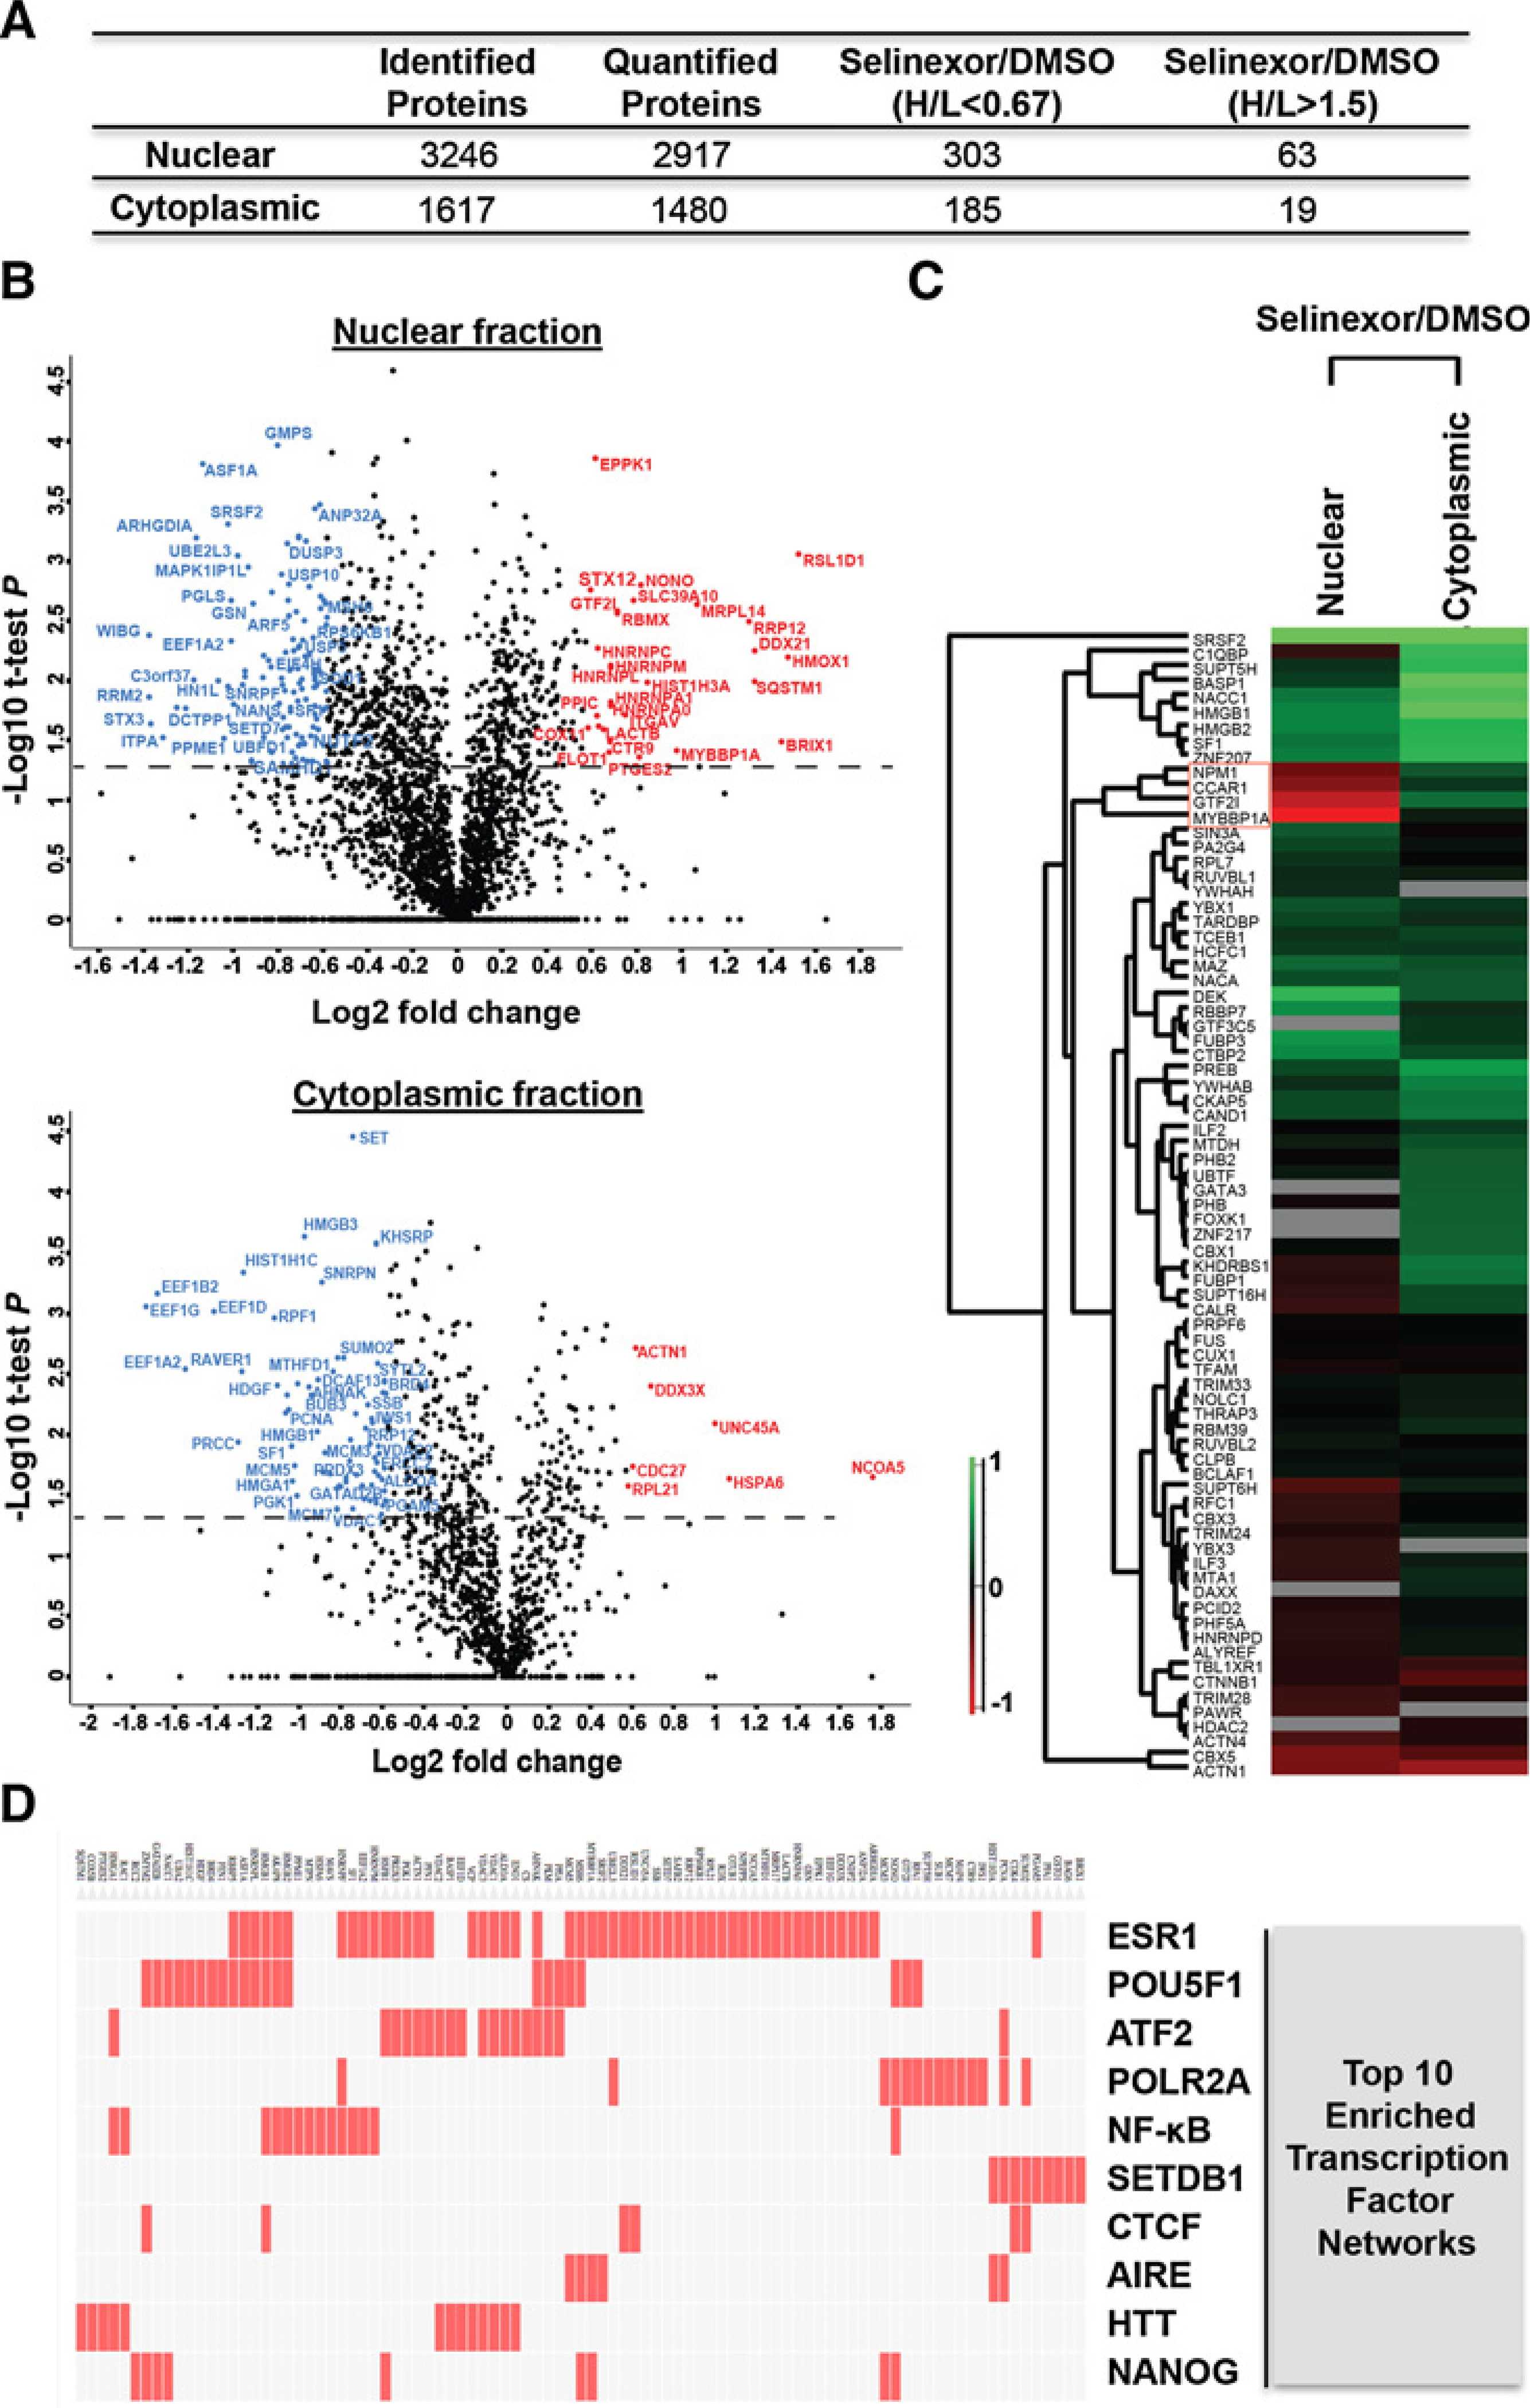
SILAC-based quantitative proteomics of nuclear and cytoplasmic fractions in IU-TAB1 cells affected by selinexor. A, Number of proteins identified and quantified from nuclear and cytoplasmic subcellular fraction of IU-TAB1 cells and the number of proteins with 1.5-fold change upon selinexor treatment (H/L >1.5 or H/L <0.67). B, Statistical analysis of the dynamic changes of the nuclear and cytoplasmic proteins affected by selinexor. Volcano plot represent the difference of protein changes in nucleus or cytoplasm between DMSO and selinexor treatment. Log2 ratios of the fold changes are plotted versus −log10 of the P values derived from a t test. Proteins with a minimum of 1.5-fold change combined with a P value smaller than 0.05 are considered significant. Blue dots, downregulated proteins; red dots, upregulated proteins. C, Hierarchical clustering of all the quantified transcription factors based on the ratios of drug treatment. Columns represent different subcellular fractions. Rows represent quantified transcription factors. D, Top 10 enriched transcription factor protein–protein interaction networks analyzed by Clustergram. Red cells in the matrix indicate significantly changed proteins that interact with the corresponding transcription factor.