Fig. 12.
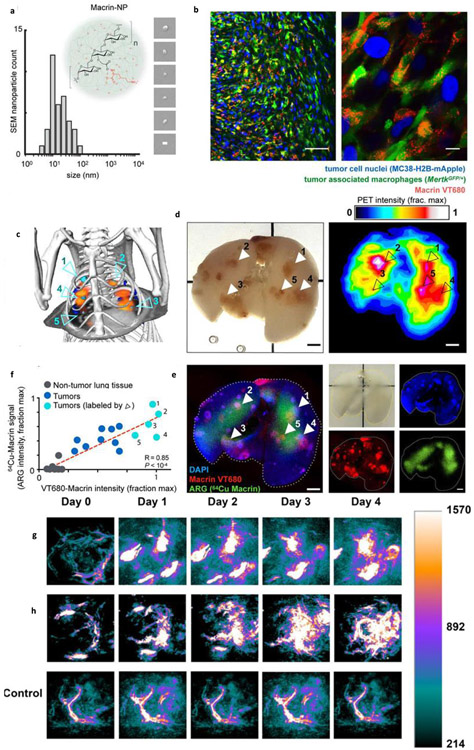
a) Size distribution of polygluocse nanoparticles (macrin) along with representative images of SEM, scale bar is 20 nm; inset: L-lysine (red) functionalized macrin (black) to attach the chelators for 64Cu and other labels. b) Confocal images of MC38 tumor at low and high magnification in MertkGFP/+ mice. c) Reconstructed PET/CT image showing the tumors in lungs (cyan and blue) and accumulation of macrin (orange). d-e) Ex vivo PET image corresponding to in vivo highlighted tumors(d), confocal images of optically cleared lung tissue(e). f) The relation of optical (VT680) and nuclear (64Cu) imaging. g, h) Phototoacoustic imaging with Au NR@SiO2 nanoparticles (g), NP-CIK cells (h) containing 6.7 μg of gold after peritumor injection. Part (a-f) adapted from reference [284], part (g-h) adapted from ref. adapted from reference [288].

