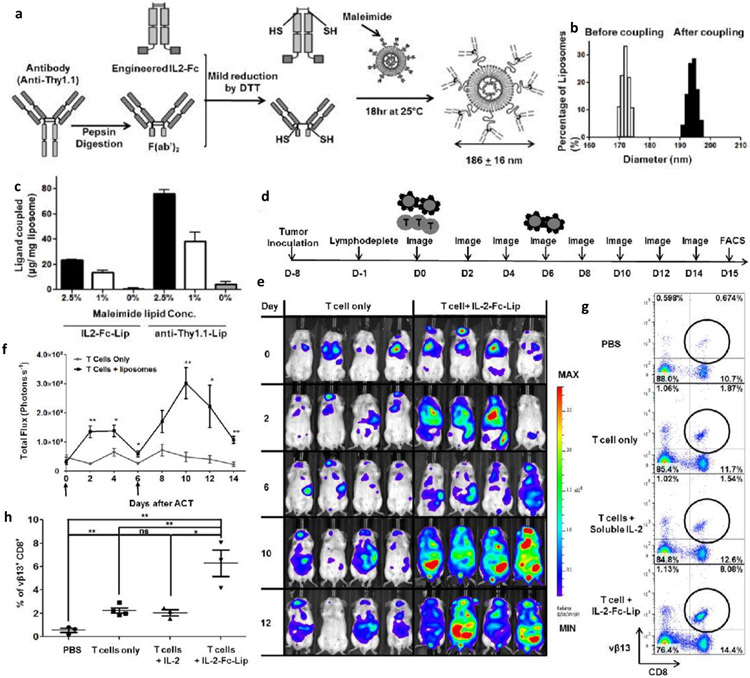
Fig. 5.
a) Schematic showing the preparation of immunoliposomes. b) Size distribution of immunoliposomes before and after coupling with T cells. c) Quantification of ligand (IL2 or anti-Thy1.1) to the liposomes containing different concentration of maleimide. d) Timeline representing the study regimen. e) Representative bioluminescent images of mice over different time periods. f) Quantitative analysis of whole-body imaging. g) Flow cytometric analysis after the adaptive transfer of the tumor-specific (vβ13 TCR+) T cells. h) Quantitative analysis of tumor-specific (vβ13 TCR+) T cells in the inguinal lymph nodes. Adopted with permission from reference [110].

