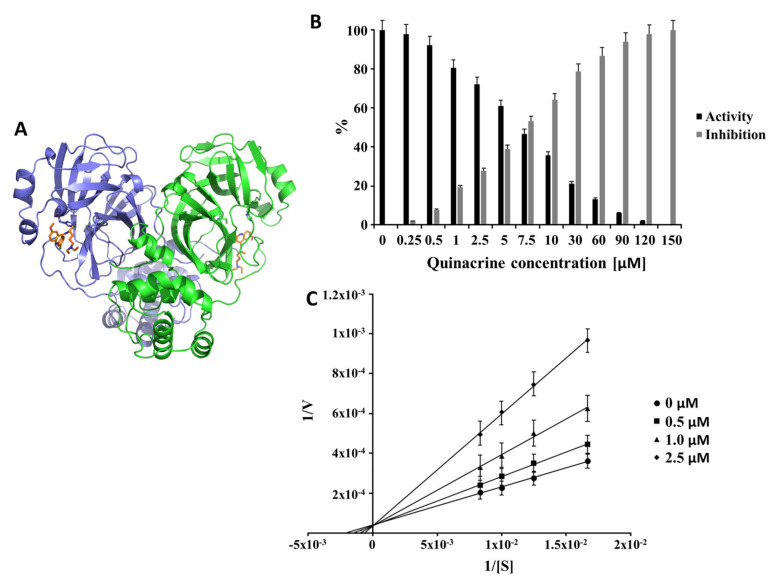
Figure 2.
Inhibition effect and inhibition mode of quinacrine over SARS-CoV-2 3CLpro: (A) 3D representation of the 3CLpro-quinacrine complex (3CLpro are indicated by ribbon presentation, and quinacrine is represented by sticks). 3CLpro monomers are colored in green and blue, and quinacrine is colored in orange. The normalized activity and inhibition of the virus proteases, as well as Lineweaver-Burk plots to determine the inhibition mode, are presented. [S] is the substrate concentration; v is the initial reaction rate; (B) normalized activity and inhibition of SARS-CoV-2 3CLpro under the quinacrine influence. (C) Lineweaver-Burk plots for the quinacrine inhibition of SARS-CoV-2 3CLpro. Data shown are mean ± SD from 3 independent measurements (n = 3).

