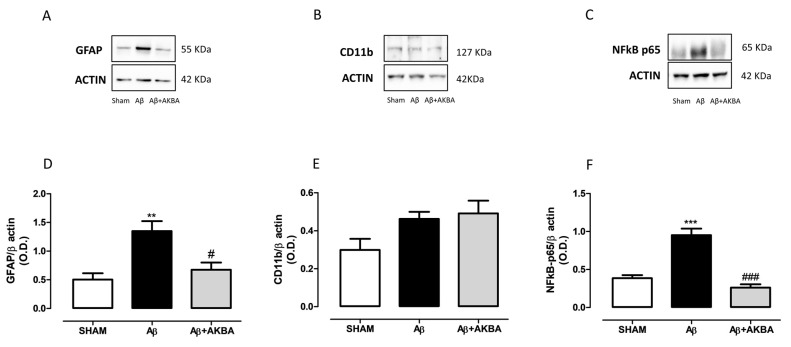
Figure 6.
Effects of AKBA administration on cortical GFAP, CD11b and NFkB-p65 levels. Representative image of Western blotting of (A) GFAP, (B) CD11b and (C) NFkB-p65. (D) Quantification of the optical density of GFAP bands normalized to the actin protein value in the PFC of mice 7 days after icv injection of vehicle (SHAM, 5 µL, white bar), Aβ (Aβ, 4 µM, black bar), and Aβ+AKBA (Aβ, 4 µM + sublingual AKBA, 5 mg/kg, gray bar), (SHAM n = 5, Aβ n = 4, Aβ+AKBA n = 4). (E) Quantification of the optical density of CD11b bands normalized to the actin protein value in the PFC of mice 7 days after icv injection of vehicle (SHAM, 5 µL, white bar), Aβ (Aβ, 4 µM, black bar), and Aβ+AKBA (Aβ, 4 µM + sublingual AKBA, 5 mg/kg, gray bar), (SHAM n = 4, Aβ n = 4, Aβ+AKBA n = 4). Quantification of the optical density of NFkB-p65 bands normalized to the actin protein value in the PFC of mice 7 days after icv injection of vehicle (SHAM, 5 µL, white bar), Aβ (Aβ, 4 µM, black bar), and Aβ+AKBA (Aβ, 4 µM + sublingual AKBA, 5 mg/kg, gray bar), (F) SHAM n = 4, Aβ n = 4, Aβ+AKBA n = 4). One-way ANOVA followed by Tukey’s multiple comparison test, ** p < 0.01, *** p < 0.001 Aβ versus SHAM; # p < 0.05, ### p < 0.001 Aβ+AKBA versus Aβ.

