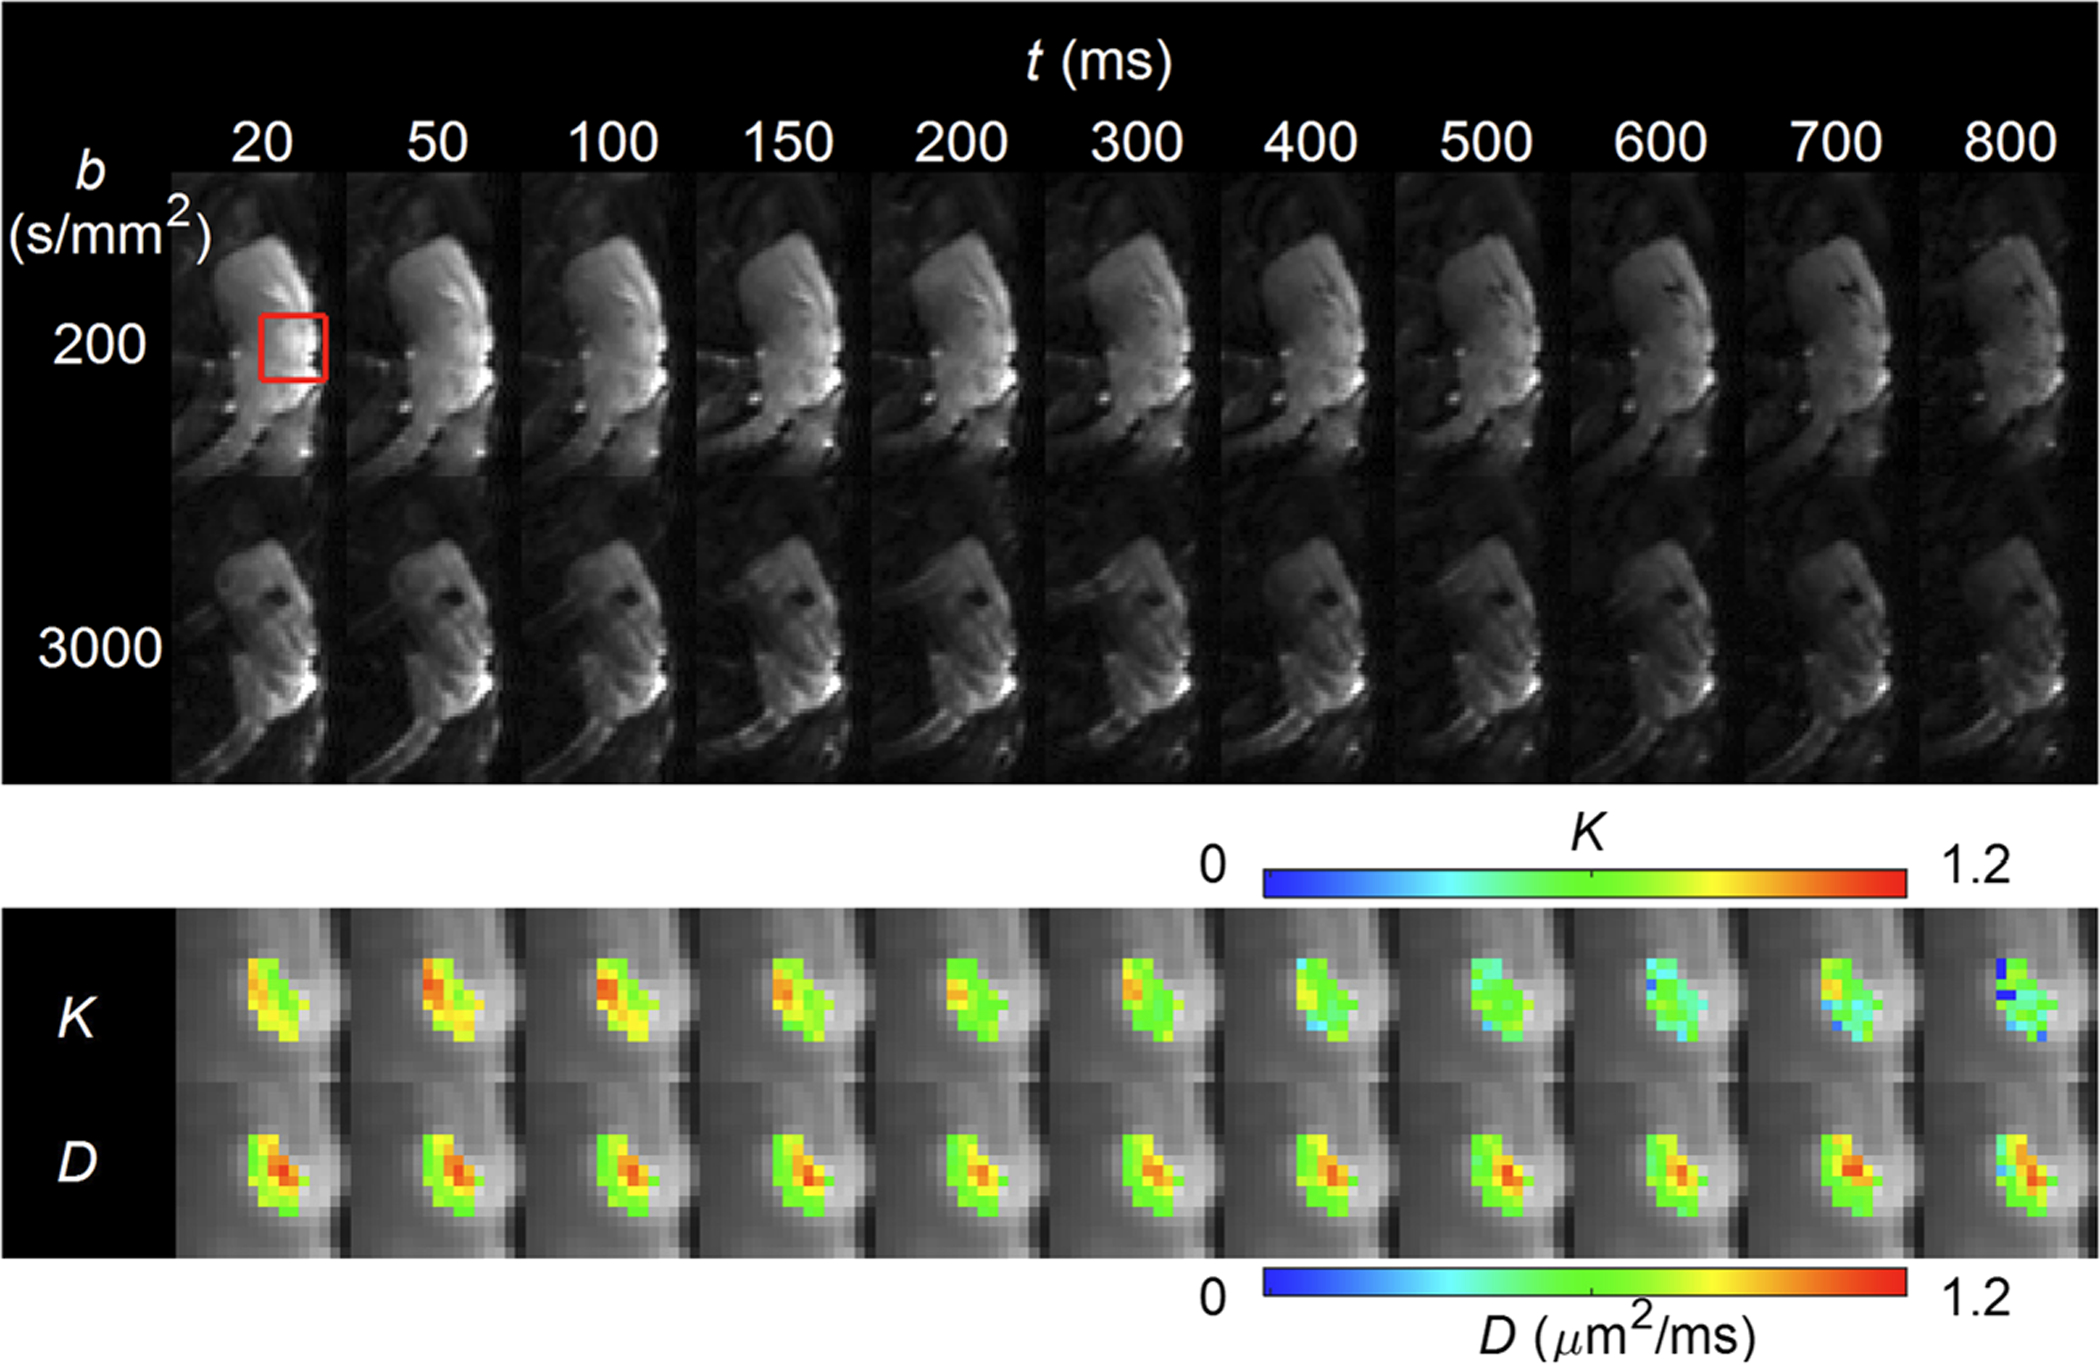
FIGURE 1.

Representative diffusion-weighted images of one of the mice with the GL261 murine glioma model. The top panel shows one slice in the middle of the tumor with the lowest and highest b-values (ie 200 and 3000 s/mm2) at all the diffusion times used in this study between 20 and 800 ms. A red box marks the area with the tumor. The area in the red box is shown in the lower panel with the estimated D(t) and K(t) maps for individual diffusion times, which demonstrate substantial decreases of K(t) in most voxels
