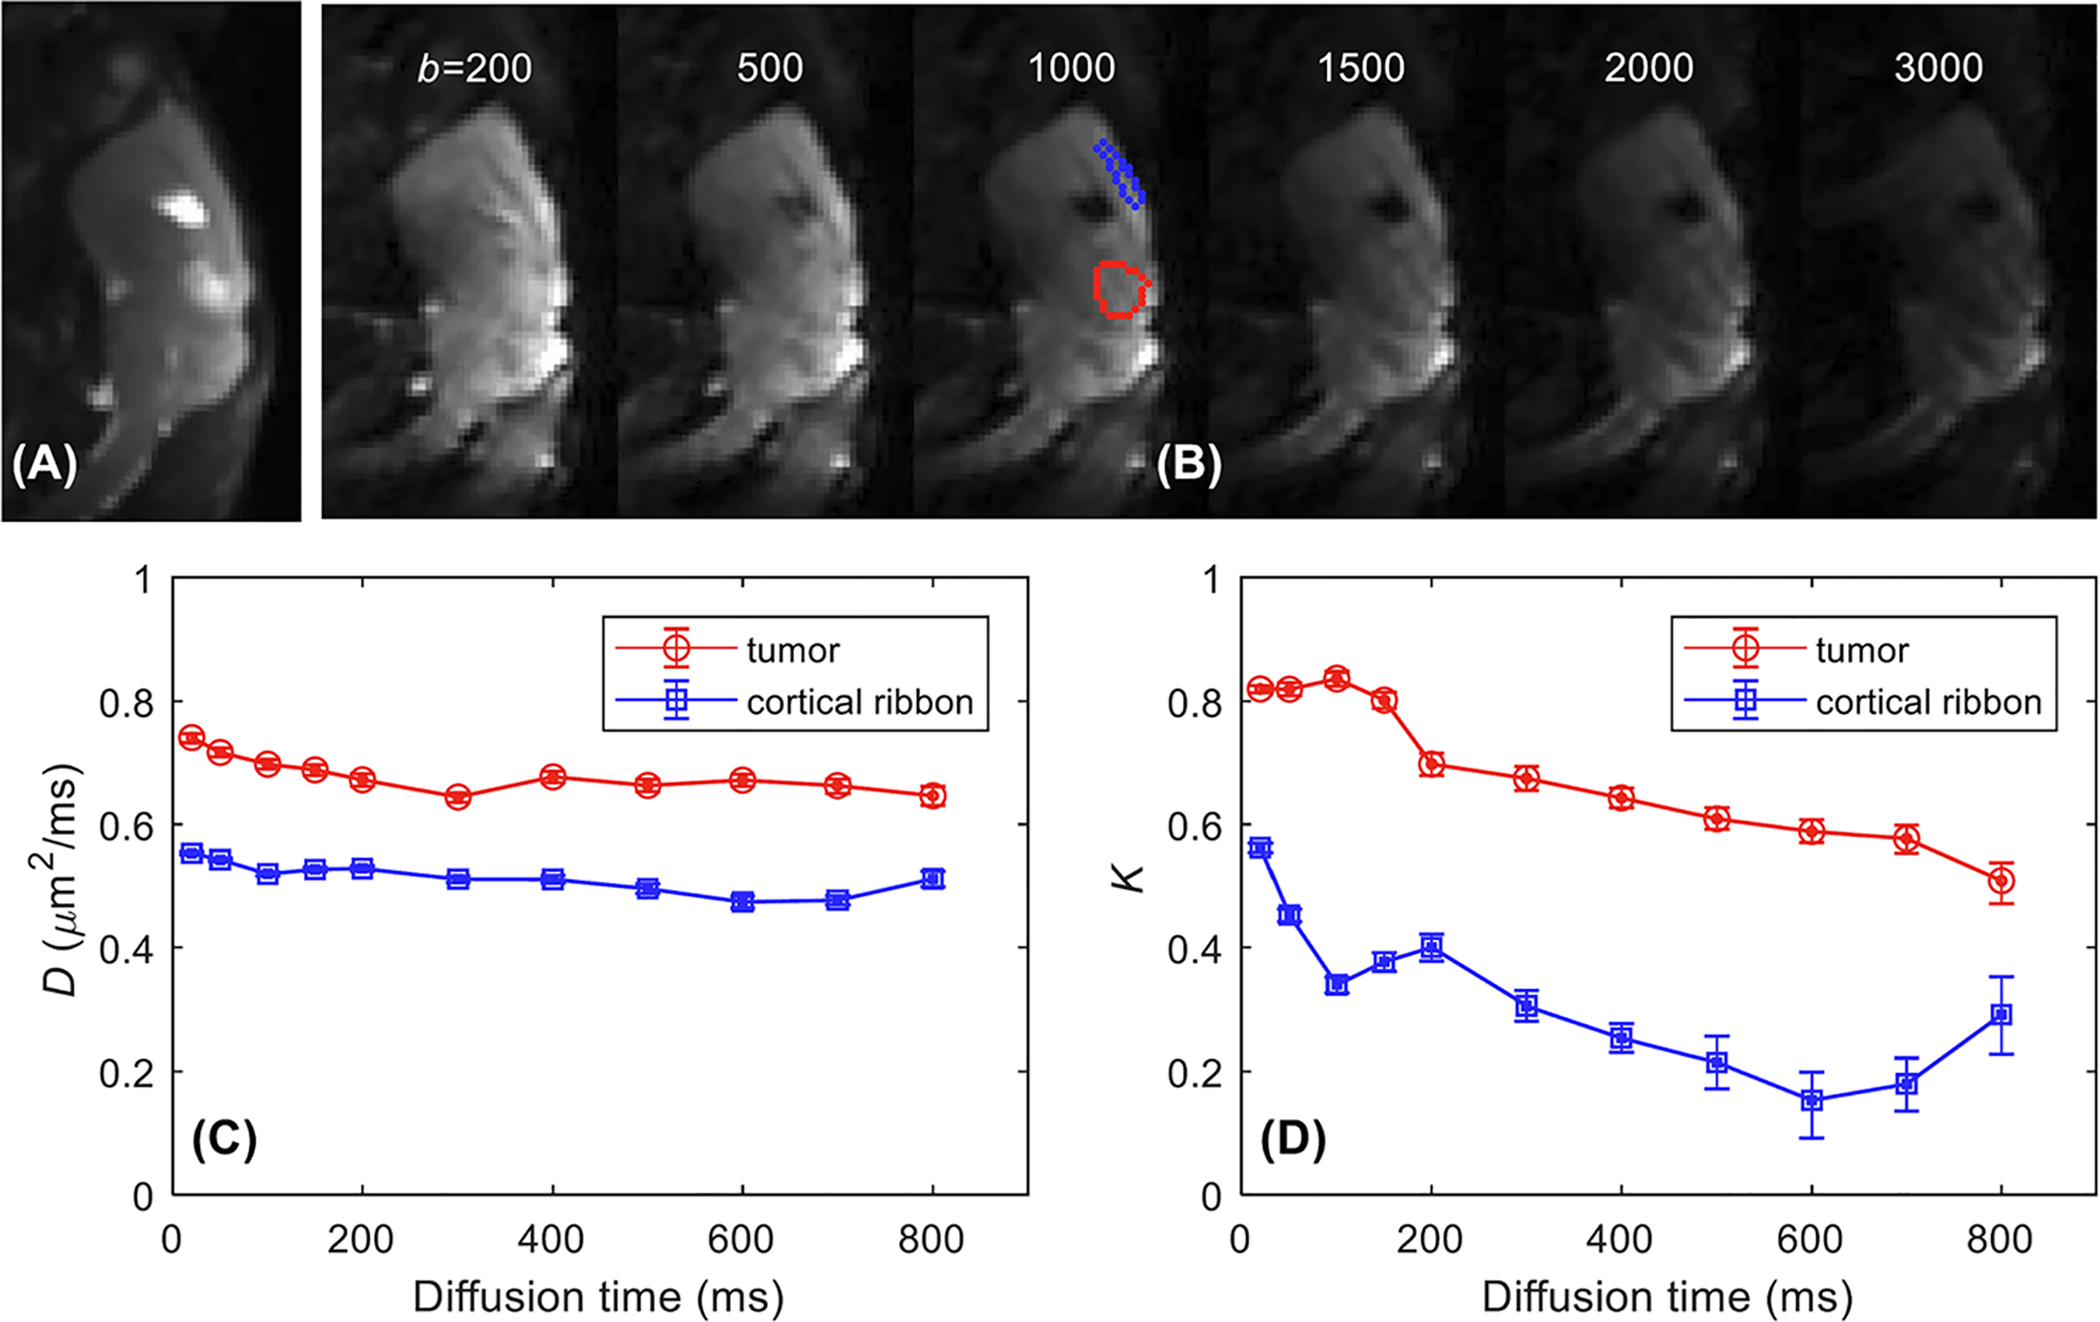
FIGURE 2.

A representative example of tDKI data acquired from a GL261 tumor (the same one as shown in Figure 1). A, T2-weighted RARE sagittal image that was used to identify the tumor. B, Diffusion-weighted images for diffusion time t = 200 ms with different b-values (s/mm2) with tumor (red ROI) and cortex ribbon (blue ROI) delineated on the T2-weighted RARE image. C, D, Median D(t) (C) and K(t) curves (D) show the diffusion time dependence of diffusivity and kurtosis for the tumor and the cortical ribbon from the bootstrapping analysis
