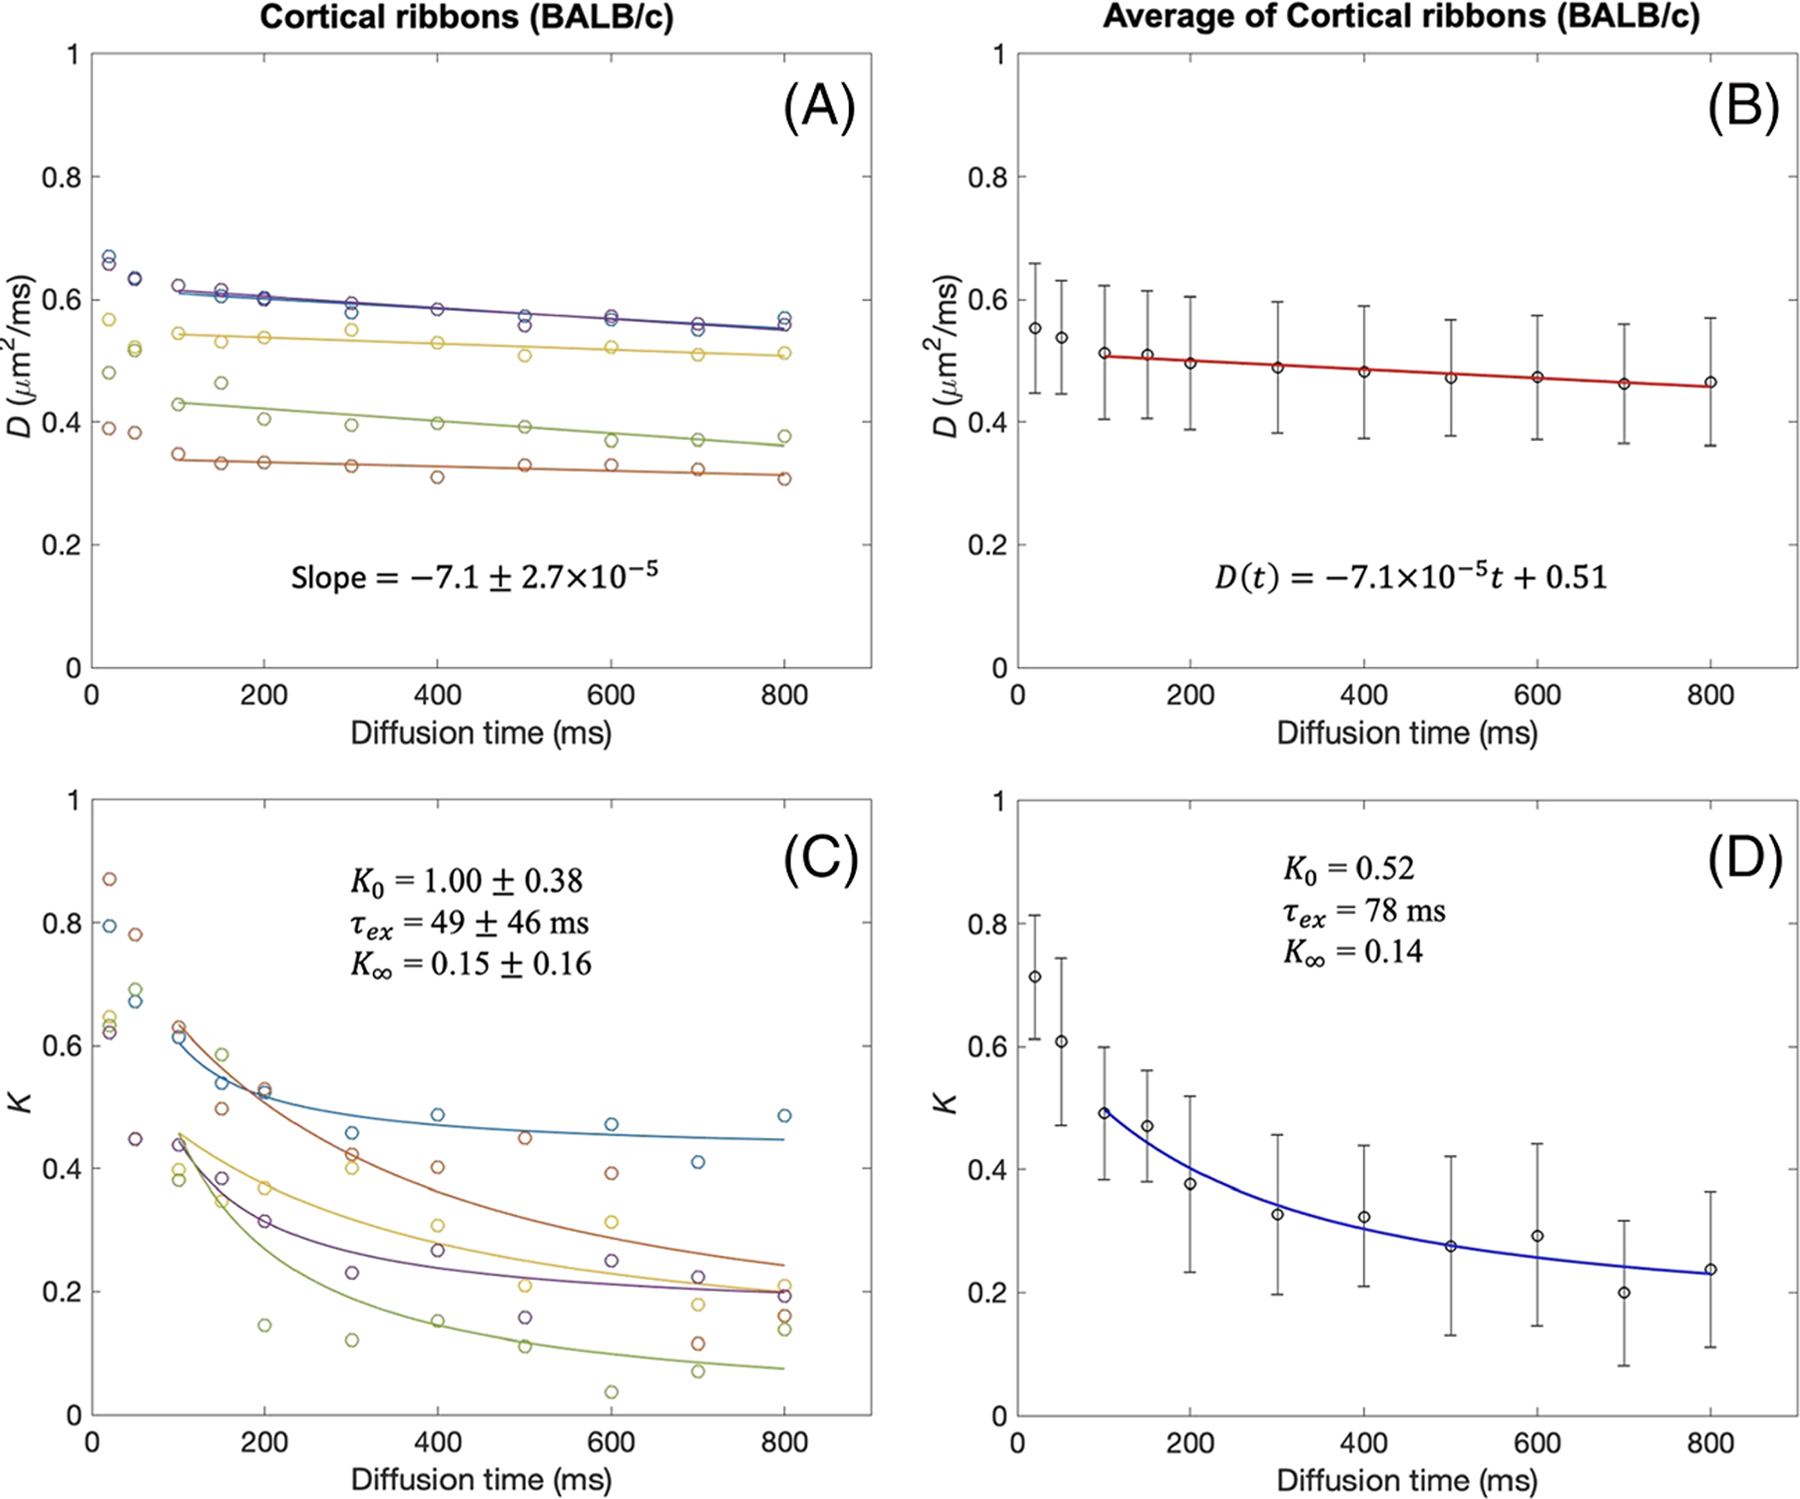
FIGURE 6.

tDKI metrics in the cortical ribbon of BALB/c mouse brains. A, B, Diffusivity shows a weak time dependence for t = 100–800 ms, with the slopes of linear model fits (solid lines) close to zero, in each tumor (A) and the data averaged over all tumors (B). C, D, For the same diffusion times, kurtosis shows a distinct time dependence that can be well described by the Kärger model (solid lines) in each tumor (C) and the data averaged over all tumors (D)
