FIGURE 8.

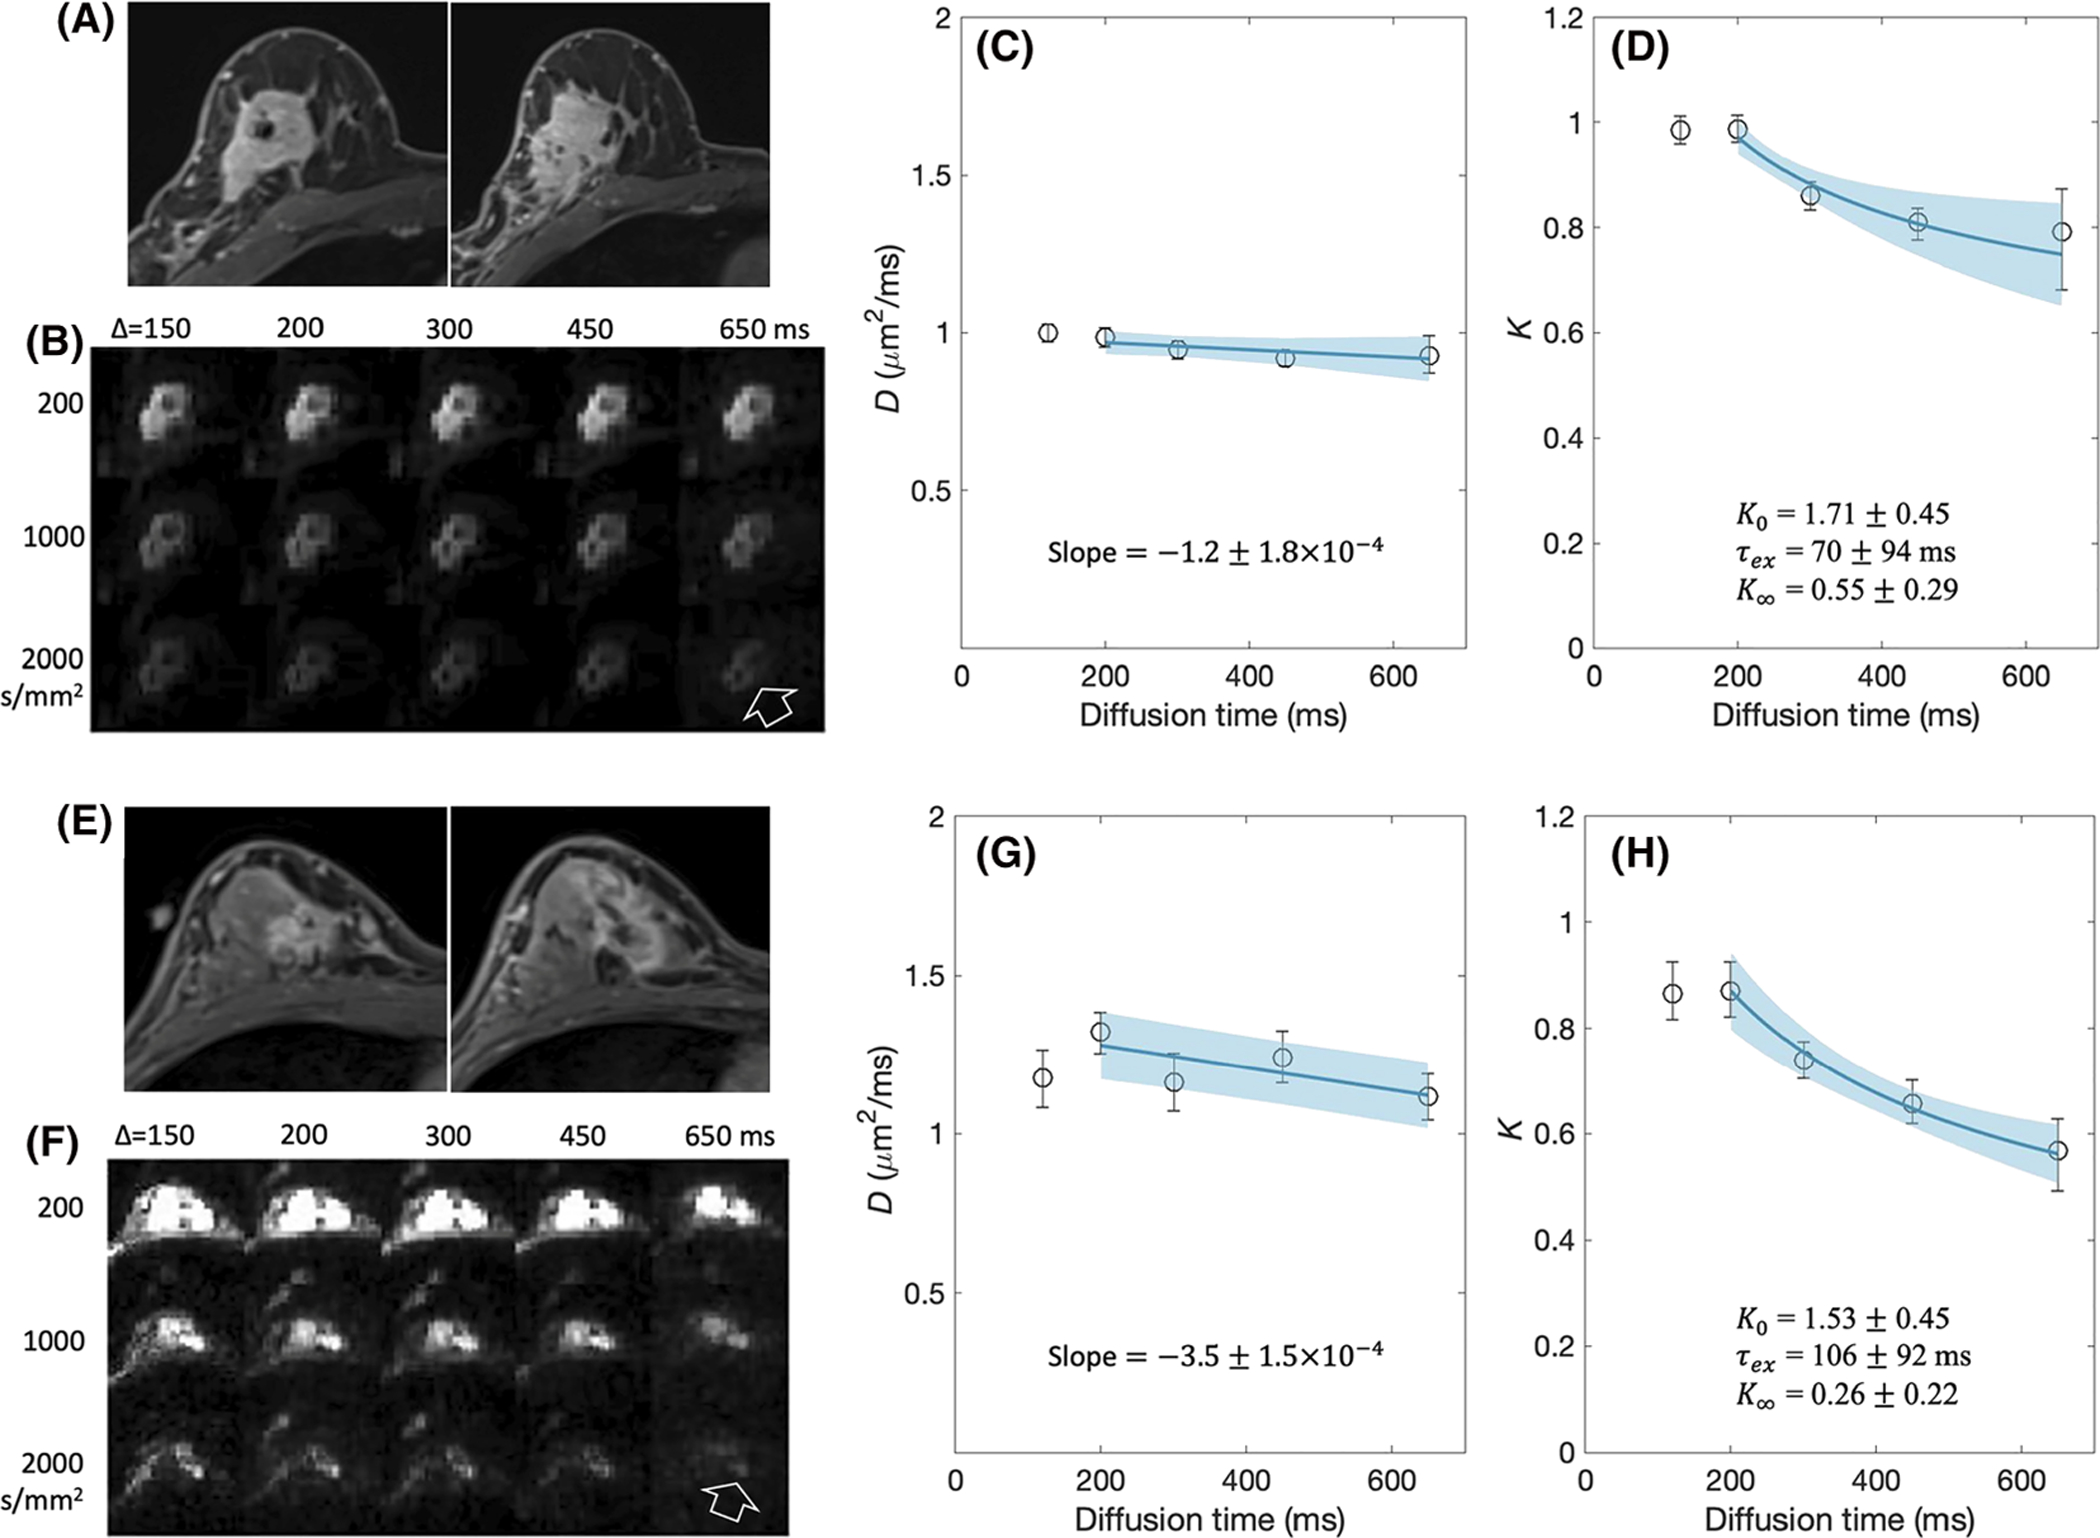
tDKI data of two biopsy proven invasive ductal carcinomas in a 35-year-old woman (A-D) and a 56-year-old woman (E-H). A, E, Post-contrast T1-weighted images are angled oblique axial slices as per the clinical breast imaging protocol. Two adjacent slices are shown to roughly match the lesion on the axial diffusion-weighted images that are not angled. B, F, Diffusion-weighted images with multiple b-values and diffusion times for one slice with the cancer lesion shown in A, E. The lesion is shown clearly in these diffusion-weighted images with fat suppression (arrow). C, G, D(t) measured from the tumor is shown by a plot of the mean values with the error bars for the standard deviation. D, H, K(t) measured from the tumor is shown by a plot of the mean values with the error bars for the standard deviation. The solid lines are the linear model fits for D(t) and the Kärger model fits for K(t) with the standard deviations shown by the shaded areas
