Fig. 4.
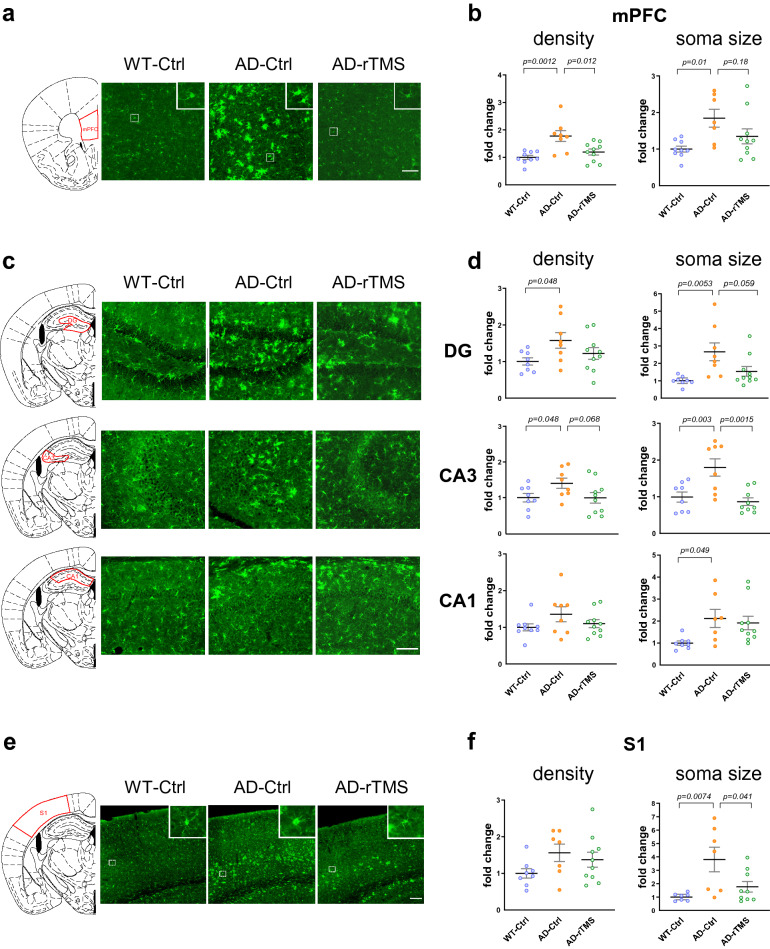
rTMS decreases microglial density and soma size in the 5xFAD brains. a Representative images of the microglia marker IBA1 staining in the mPFC. Top right insert: enlarged images demonstrating the soma size of the microglia. Scale bar: 100 μm. b Quantitative analyses of the density and the soma size of IBA1-labelled microglia in the mPFC across groups (n = 8–10 mice per group, 124 ± 4 cells per section were sampled for the analysis). c. Representative images of the microglia marker IBA1 staining in different subregions of dorsal hippocampus. Top right insert: enlarged images demonstrating the soma size of the microglia. Scale bar: 100 μm. d Quantitative analyses of the density and the soma size of IBA1-labelled microglia in different subregions of hippocampus across groups (n = 8–10 mice per group, 154 ± 7, 134 ± 16 and 200 ± 28 cells were sampled from DG, CA3 and CA1 brain regions for analysis). e Representative images of the microglia marker IBA1 staining in the S1 cortex. Top right insert: enlarged images demonstrating the soma size of the microglia. Scale bar: 100 μm. f Quantitative analyses of the density and the soma size of IBA1-labelled microglia in the S1 cortex across groups (n = 7–10 mice per group, 554 ± 60 cells per section were sampled for analysis). All data are presented as mean ± SEM of the fold change of the WT-Ctrl group and analyzed by one-way ANOVA followed by Tukey's multiple comparisons test. WT-Ctrl: wildtype littermates received sham treatment, AD-Ctrl: 5xFAD mice received sham treatment, AD-rTMS: 5xFAD mice received rTMS treatment. mPFC: medial prefrontal cortex, DG: dentate gyrus, CA3: cornu ammonis 3, CA1: cornu ammonis 1, S1: primary sensory cortex

