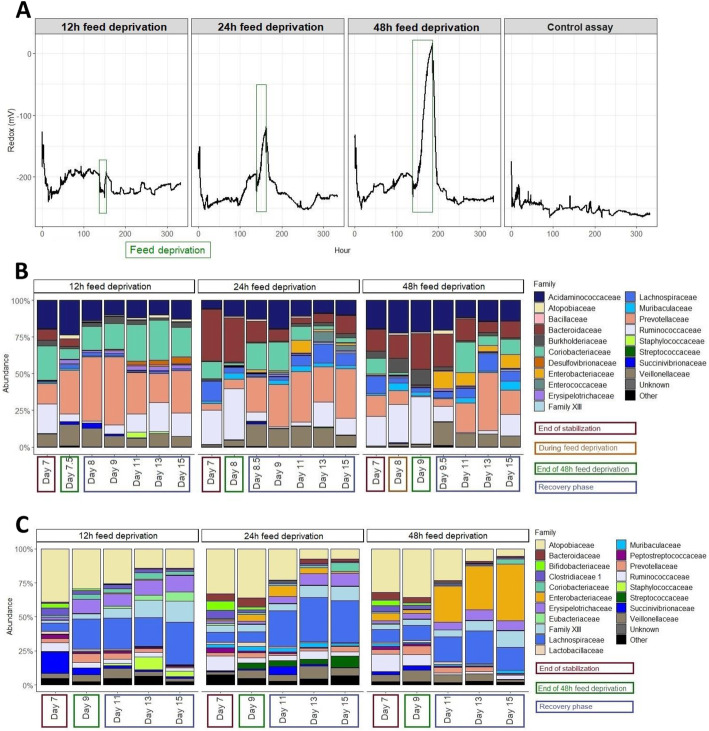
Fig. 6.
Effects of a feed deprivation stress of 12, 24, and 48 h on the MPigut-IVM microbiota composition. On this figure, the “12h feed deprivation stress”, “24h feed deprivation stress” and “48h feed deprivation stress” correspond to the fermentations #4, 5 and 6, respectively. a Evolution of the redox potential. An example of redox measurement for a control assay is provided one the figure. These data are from the fermentation 2. b Effect of a feed deprivation period of 12, 24 or 48 h on the relative abundance of the main bacterial families in the bioreactor medium of the MPigut-IVM as measured by 16S Illumina sequencing. c Effect of a feed deprivation period of 12, 24 or 48 h on the relative abundance of the main bacterial families on the mucin beads of the MPigut-IVM as measured by 16S Illumina sequencing

