Fig. 2.
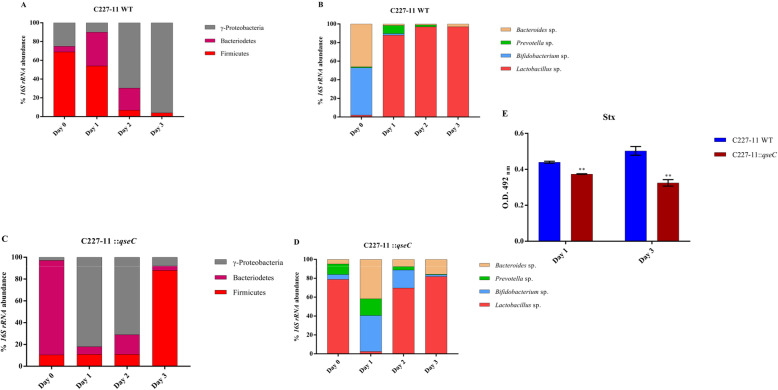
Microbiota predominance modulated via QseC during C227–11 infection in the SHIME® model. Relative microbiota abundance analysis via qRT-PCR of 16 s rRNA of phyla and genera. Microbiota composition from days 0 to 3 p.i with strain C227–11 infection, respectively, phyla and genera (a and b), and with strain C227–11::qseC infection, respectively, phyla and genera (c and d). ELISA Immunoassay capture to measure the Stx levels from the output collected during the SHIME® infection, day 1, ** p = 0.002 and 3 p.i., ** p = 0.009 (e). The statistical significance analyzes were performed on GraphPad Prism 7 via t-test

