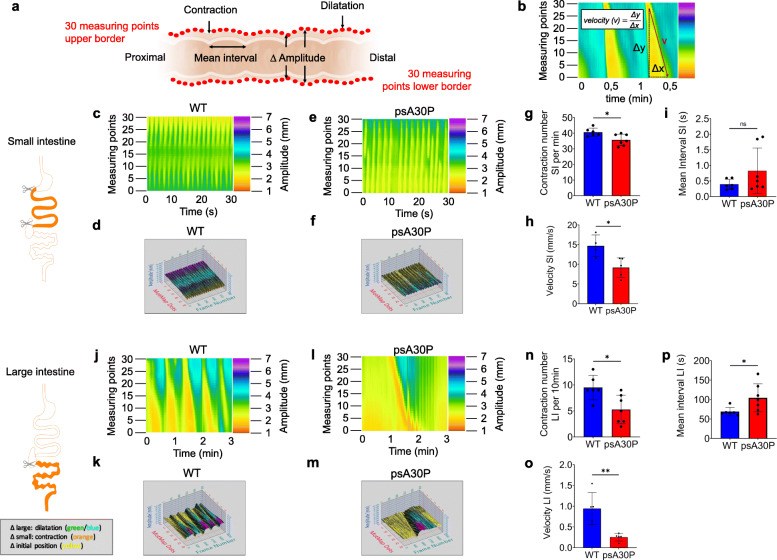
Fig. 3.
Motility patterns during ex vivo luminal perfusion experiments in pre-symptomatic (ps)A30P mice and wild type (WT) controls. (a) Video recordings of gut movements were analyzed with MotMap and LabView to determine alterations in amplitudes ∆, mean intervals and contraction numbers. (b) Schematic illustration of the velocity measured by LabView. Spatiotemporal maps and corresponding 3-D MotMaps showed altered small intestine (SI) motility (c–f) and large intestine (LI) motility (j–m). Less SI and LI motility was shown in psA30P mice compared with WT. The gut diameter in the heatmaps (pixel color) is indicated on the y-axis, the time on the x-axis. Contraction numbers were significantly lower in the SI (g) and the LI (n) of psA30P mice compared with WT controls. Mean intervals were slightly higher with more variation in the SI of psA30P mice compared with WT (i), while in the LI of psA30P mice mean intervals were significantly prolonged compared with WT (p). Velocity was significantly decreased in the SI and LI of psA30P mice compared with WT (h, o). WT mice are shown in blue, psA30P mice in red. Calculations were performed with LabView and GraphPad Prism 8. Quantitative data are expressed as means ± SD from segments of n = 7 psA30P mice and n = 6 age-matched WT controls for mean interval and contraction numbers. For velocity determination, n = 5 psA30P mice and n = 5 WT mice were examined. * p ≤ 0.05, and ** p ≤ 0.01 using Student’s t test and Cohen’s d (Supplementary Table 7b), ns = not significant

