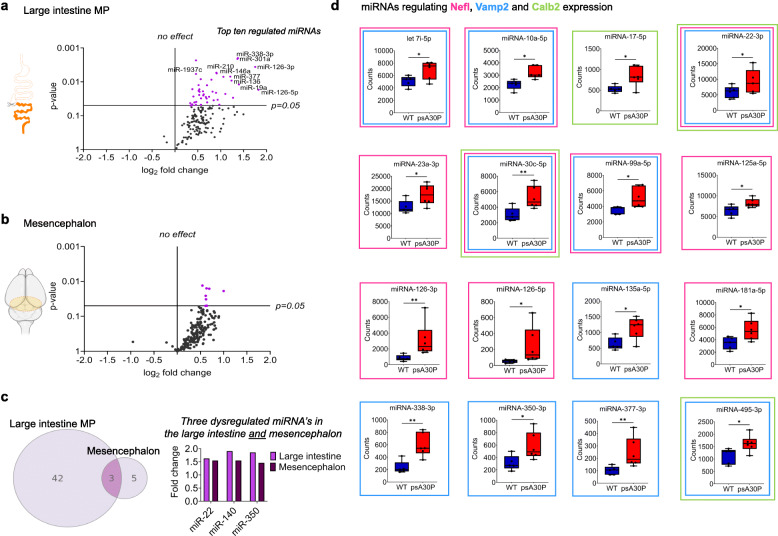
Fig. 8.
miRNA expression analysis of 2-month-old pre-symptomatic (ps)A30P mice. Volcano plots show miRNA profiling in the myenteric plexus (MP) of the large intestine (LI, a) and the mesencephalon (b) of psA30P mice compared with controls. Expression data for 578 miRNAs were generated by nCounter NanoString analysis. In total, 166 miRNAs were expressed in the MP of the LI (a) and 210 miRNAs in the mesencephalon (b) with a minimum of 100 counts. The left side represents the significance level of downregulated miRNAs and the right side the significance level of upregulated miRNAs. Purple circles indicate significantly dysregulated miRNAs; black circles indicate miRNAs whose expression was not significantly altered. The horizontal line in miRNA expression marks the threshold for the t-test p value (= 0.05). (c) In total, we identified 45 significantly upregulated miRNAs in the MP of the LI and eight upregulated miRNAs in the mesencephalon of psA30P mice. Among them, three are expressed in the MP of the LI and the mesencephalon, but with a higher fold change in the MP. (d) Box plots show regulated miRNAs in psA30P mice compared with wild types (WT) targeting neurofilament light chain (Nefl, pink framed boxes), vesicle-associated membrane protein 2 (Vamp2, blue framed boxes), and calbindin 2 (Calb2, green framed boxes). WT mice are shown in blue (n = 5), A30P mice in red (n = 6). Quantitative data are expressed as means ± SD using GraphPad Prism 8. * p ≤ 0.05 and ** p ≤ 0.01 using Student’s t test and Cohen’s d (Supplementary Table 7f)

