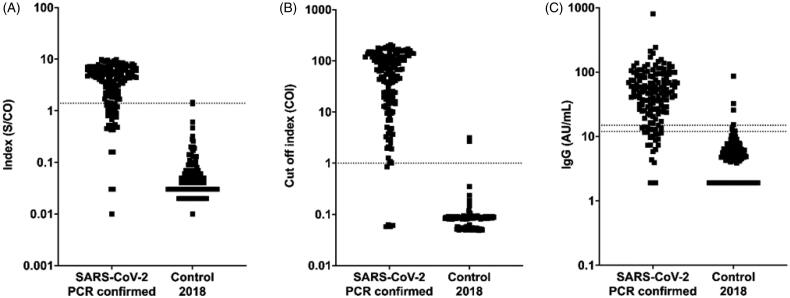
Figure 1.
Differences in distribution patterns between Abbott, Roche and DiaSorin immunoassays for detection of SARS-CoV-2 antibodies. Measured values from serology testing of 152 positive (SARS-CoV-2 PCR confirmed) and 150 negative samples. Dotted lines represent cut-off values of (A) Abbott: positive result index ≥1.4 S/CO, (B) Roche: positive cut-off index (COI) ≥1.0 and (C) DiaSorin: positive cut-off ≥15 AU/mL and equivocal 12–15 AU/mL. For DiaSorin, negative samples with signals below the detection limit (3.8 AU/mL) were plotted as 1.9 AU/mL and positive signals >400 AU/mL were plotted as 800 AU/mL.

