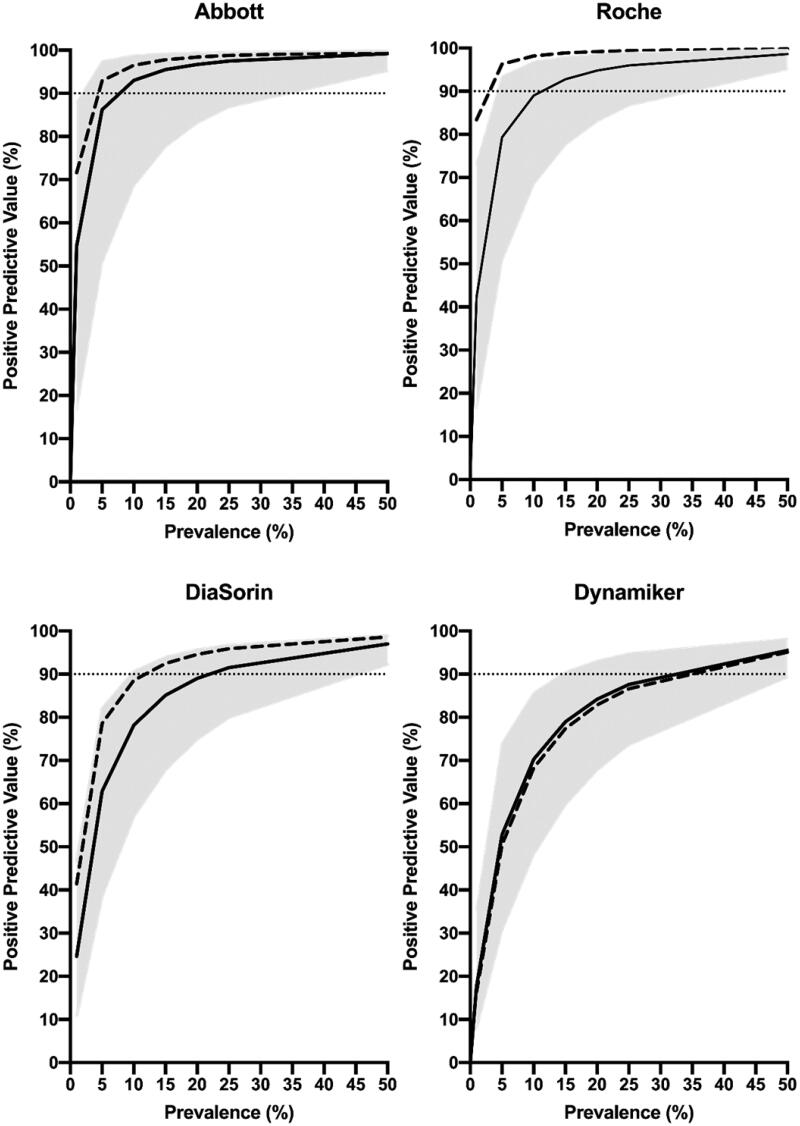
Figure 2.
Estimated PPV for the assays, calculated at seroprevalences of 1%, 5%, 10%, 15%, 20%, 25% and 50%. Calculations were based on sensitivity, specificity and respective 95% CI limits (solid lines = mean values; grey areas = 95% CI). Dashed lines represent mean sensitivity and specificity data from the manufacturers' kit inserts. Dotted horizontal lines refer to 90% PPV.

