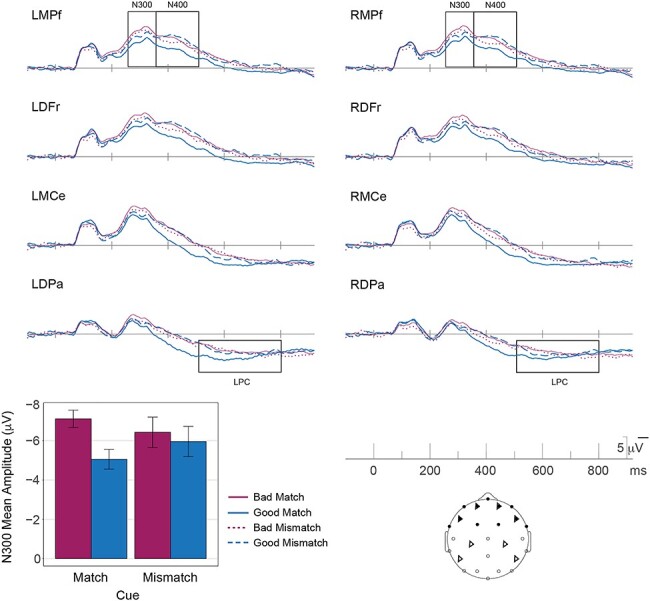
Figure 3.

Grand average ERP waveforms for the good match (solid-blue), bad match (solid-maroon), good-mismatch (dashed-blue), and bad-mismatch (dotted-maroon) conditions in Experiment 2 are shown at the same 8 representative electrode sites. In the match condition, responses to good and bad exemplars differ in the N300 time-window (250–350 ms), with greater negativity for bad exemplars as compared with good exemplars, over frontal sites (darkened electrode sites on the schematic of the scalp). In the mismatch condition, the differences between good and bad exemplars on the N300 are diminished/eliminated. The bar plot gives the grand average mean of the ERP amplitude over the 11 frontal electrode sites (darkened electrode sites on the schematic of the scalp) used for the primary statistical analyses (N = 20). The plotted error bars are within-subject confidence intervals.
