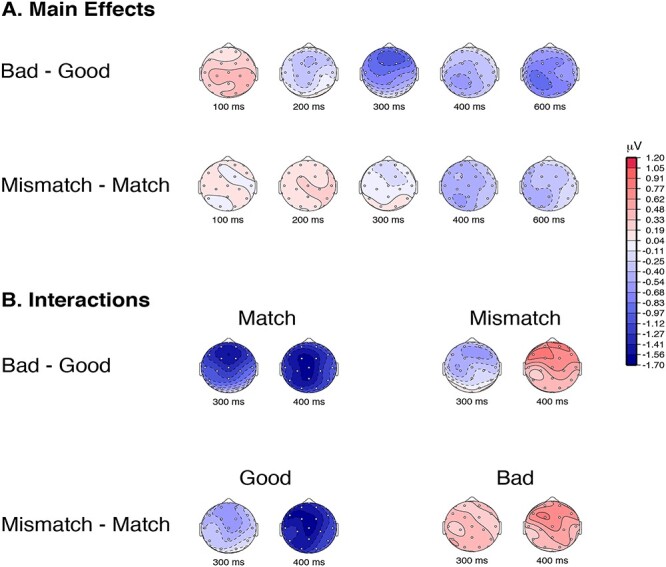
Figure 4.

(A) Topographic plots of the difference waves for the 2 main effects of representativeness (Bad–Good) and cueing (Mismatch–Match). In the N300 time-window the 2 main effects are qualitatively similar, with both main effects showing a frontal distribution. The N300 time-window also shows a quantitatively larger effect for the representativeness (Bad–Good) than for the cueing (Mismatch–Match). In the N400 time-window, both effects are centro-parietally distributed with a slight left laterality. (B) Topographic plots for the difference in the interactions for Good/Bad × Cuing are shown in 2 interpretations: in terms of the Good/Bad effect—(Bad–Good) × Match and (Bad–Good) × Mismatch; and in terms of the cuing effect—Good × (Mismatch–Match) and Bad × (Mismatch–Match).
