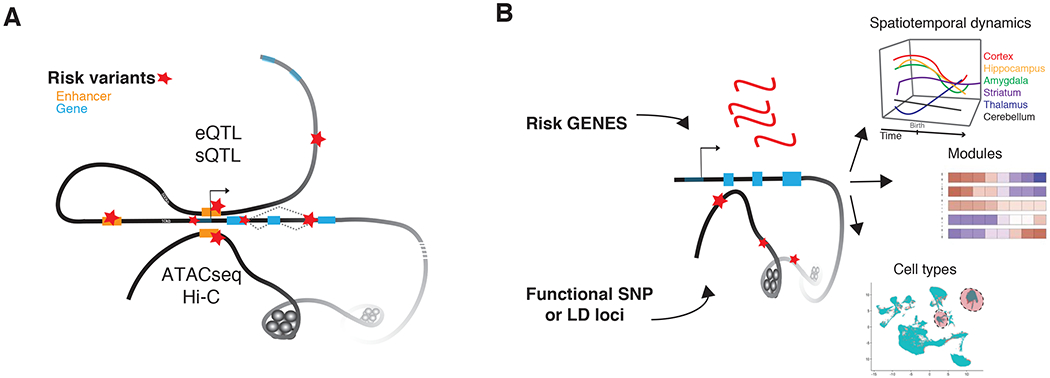
Figure 2. Functional Genomics Links Genetic origins to Disease Mechanisms.

A) Depiction of annotation of risk variation to specific genes. DNA is depicted as a black line with a simple gene model: right hand arrow depicts a transcriptional start site, blue rectangle represents exons, and grey diagonal, connections between exons as isoform options. Enhancers are depicted as orange rectangles and risk variants are marked by red stars. The top extension of DNA from the gene body illustrates mapping by either eQTL or sQTL of a proximal risk variant to a gene. The bottom extension of DNA illustrates long-range DNA contacts (cis or trans), through the combination of ATACseq and Hi-C datasets, to map risk variants to specific genes. B) Cartoon of the two basic integrative approaches used to collapse polygenic disease variation to specific temporal epochs, regions, cell types and network modules. These methods are often thought of interchangeably, but should be distinguished: 1) top, risk genes (red) identified through the annotation with core functional maps in (A) are used in comparison to, 2) bottom, SNPs or multi-SNP loci (LD, red stars) are mapped directly to regulatory regions (open chromatin) to look for enrichment in regulatory regions that are active in specific spatiotemporal datasets across time and brain regions, modules of specific pathways and processes, cell types from single-cell technological approaches from normal human reference and/or postmortem case datasets.
