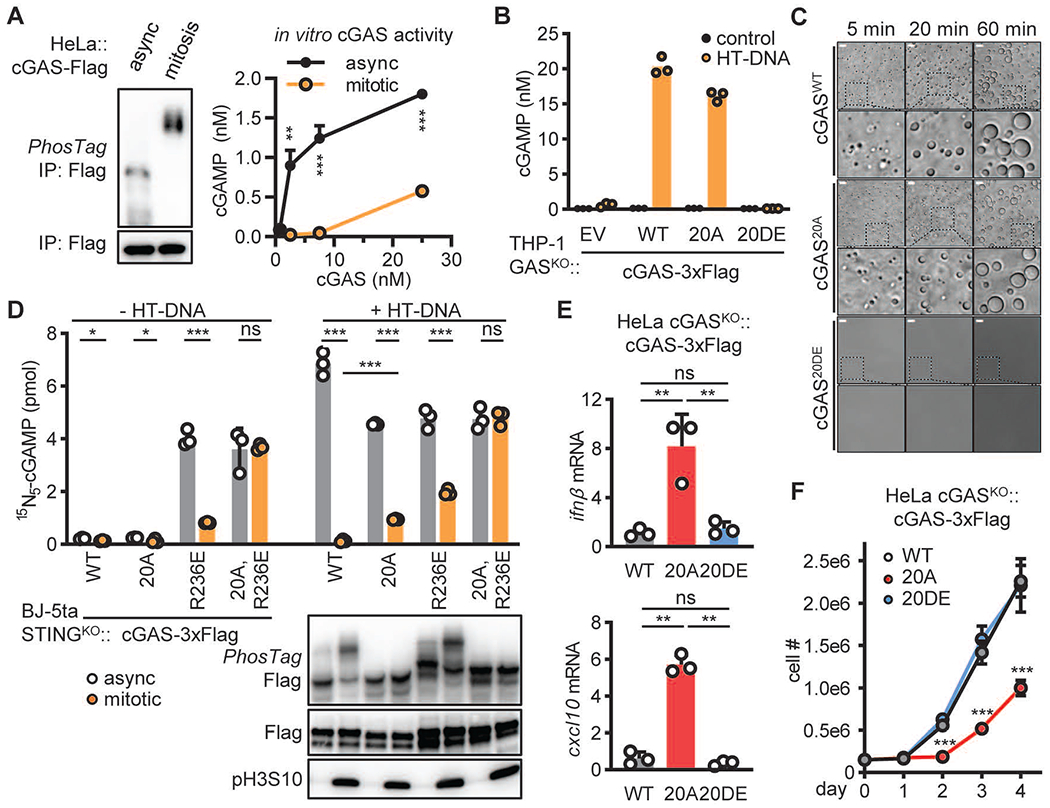
Fig. 3. Mitotic hyperphosphorylation suppresses cGAS activity.

. (A) HeLa cells stably expressing cGAS-Flag were synchronized with thymidine and nocodazole or center untreated (async). cGAS-Flag proteins isolated from these cells were analyzed using PhosTag electrophoresis (left) or an in vitro enzymatic assay (right). (B) THP-1 cGASKO cells stably expressing cGASWT, cGAS20A, or cGAS20DE were transfected with HT-DNA. The level of cGAMP was measured at 4 hours after transfection. (C) 5 μM recombinant cGASWT, cGAS20A, or cGAS20DE was incubated with 5 μM 100 bp dsDNA in a physiological buffer at 37°C for the indicated time. Phase separation was visualized using bright field microscopy. Size bars = 10 μm. (D) STING-deficient BJ-5ta cells stably expressing Flag tagged cGASWT, cGAS20A, cGASR236E or cGASR236E, 20A were synchronized with thymidine and nocodazole or center untreated (async). Hypotonic lysates of resulting cells were incubated with ATP, 15N5-GTP, and with or without HT-DNA at 37°C for 1 hr to measure the cGAS product 15N5-cGAMP with quantitative mass spectrometry (upper). PhosTag electrophoresis shows the level of cGAS phosphorylation and immunoblotting shows the level of pH3S10 (lower). (E) The levels of ifnβ and cxcl10 RNA in HeLa cGASKO cells stably expressing C-terminally 3xFlag tagged cGAS, cGAS20A, or cGAS20DE were quantified by RT-qPCR. (F) The growth curves of the cells shown in (E). (A, D-F) Data represent mean ± SD (N=3). Unpaired t-test: ns, not significant; *, p≤0.05; **, p≤0.01; *** p≤0.001.
