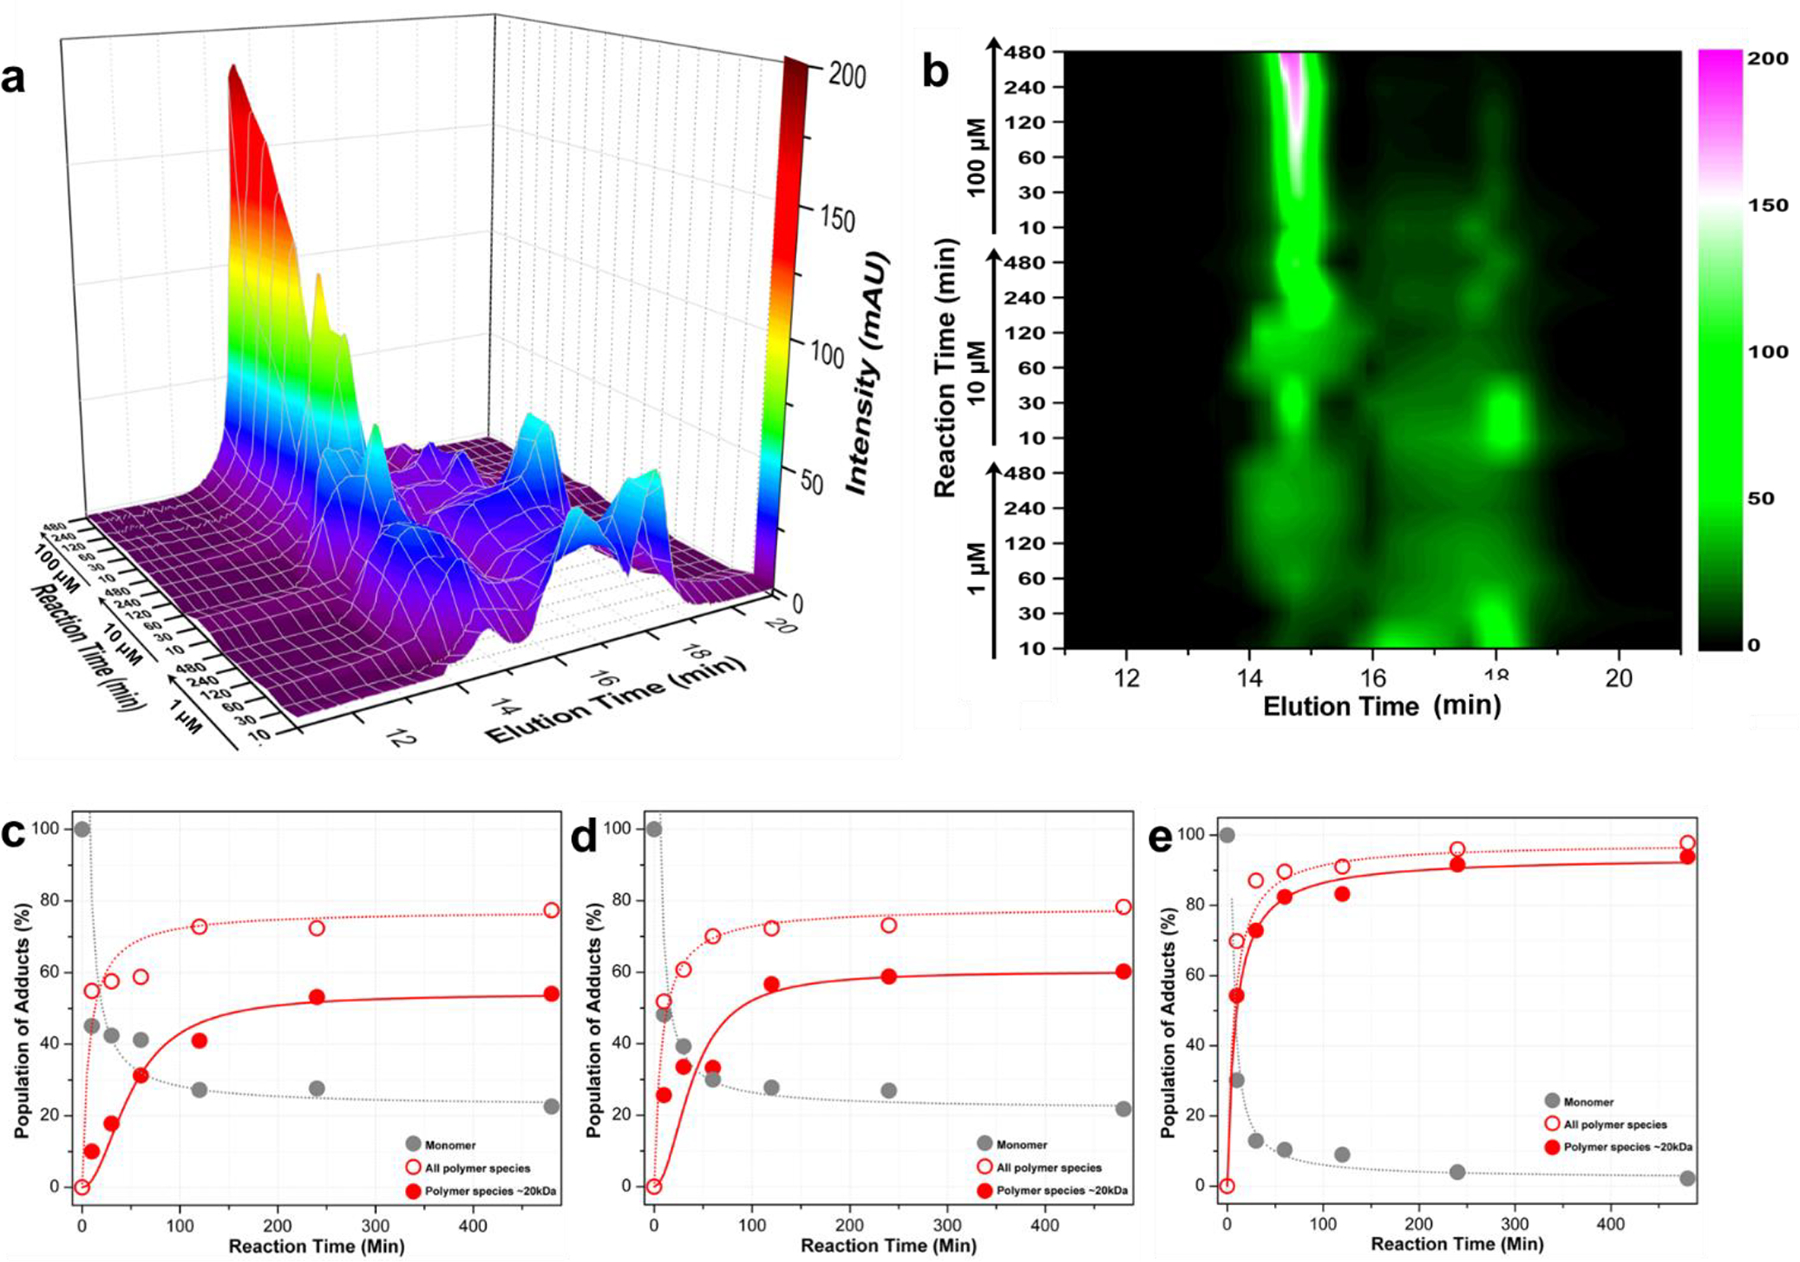
Figure 2. Characterization of polymerization.

a. Comparison of elution profiles of the polymerization reaction of probe 3 at various concentrations (1, 10, 100 μM, as indicated) after different reactions times (10, 30, 60, 120, 240, 480 min, as indicated). The molecular weights of peaks at TE = 14.8 min and 17.7 min are 25 kDa and 1 kDa respectively (Supporting Fig. S4); the peak at 16.5 min contains trimers and higher-order oligomers as detected by MALDI-MS (Supporting Fig. S6). b. 2D intensity contour image of the elution profiles at indicated concentrations and reaction time points. c, d, e. Products population of the reaction at 1, 10, and 100 μM vs. time, respectively.
