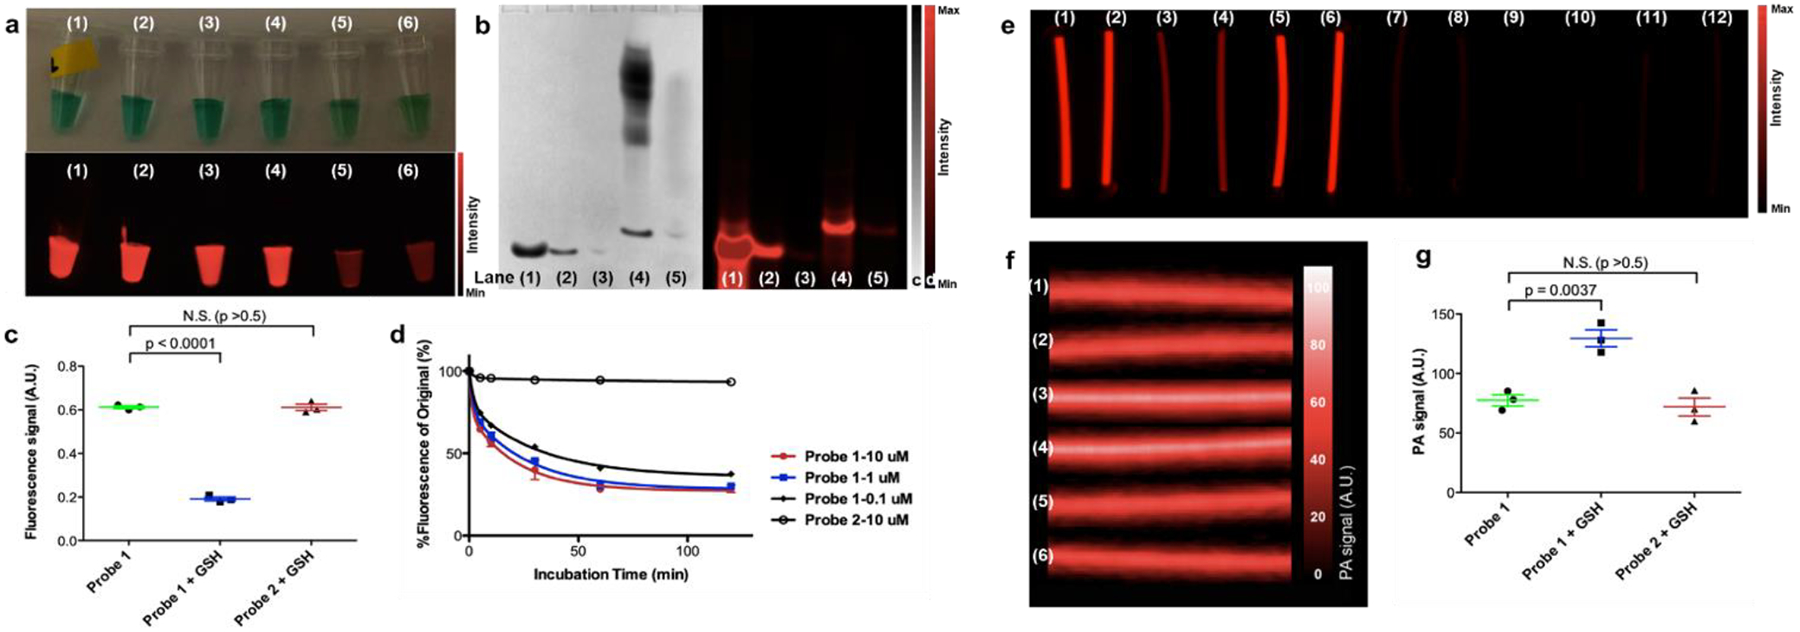
Figure 3. Characterization of polymerization using fluorescence and photoacoustic signals.

a. White light (upper) and fluorescence (lower) images of (1) probe 2 (100 μM) in PBS buffer at pH 7.4, (2) probe 2 (100 μM) in PBS buffer containing TCEP (10 mM) at pH 7.4, (3) probe 2 (100 μM) in PBS buffer containing GSH (10 mM) at pH 7.4, (4) probe 1 (100 μM) in PBS buffer at pH 7.4, (5) probe 1 (100 μM) in PBS buffer containing TCEP (10 mM) at pH 7.4, (6) probe 1 (100 μM) in PBS buffer containing GSH (10 mM) at pH 7.4. b. Silver nitrate staining (left) and fluorescence image (right) of gel electrophoresis (25% acrylamide gel) of (1) probe 2 (6 nmol), (2) probe 2 (0.6 nmol), (3) probe 2 (0.06 nmol), (4) probe 1 (6 nmol), and (5) probe 1 (0.6 nmol) in loading buffer containing GSH (10 mM) at pH 7.4. c. Quantification of fluorescence signals of probe 1 (100 μM) in PBS buffer at pH 7.4, probe 1 (100 μM) with GSH (10 mM) at pH 7.4, and probe 2 (100 μM) with GSH (10 mM) at pH 7.4 after 30 min incubation. d. Fluorescence changes of probe 1 at 0.1, 1, 10 μM and probe 2 at 10 μM over two hours at pH 7.4. e. Fluorescence images of sealed PE tubes of (1) and (2) probe 1 (100 μM) in PBS buffer at pH 7.4, (3) and (4) probe 1 (100 μM) in PBS buffer containing GSH (10 mM) at pH 7.4, (5) and (6) probe 2 (100 μM) in PBS buffer containing GSH (10 mM) at pH 7.4. (7) and (8) probe 1 (100 μM) in PBS buffer at pH 7.4, (9) and (10) probe 1 (100 μM) in PBS buffer containing GSH (10 mM) at pH 7.4, (11) and (12) probe 2 (100 μM) in PBS buffer containing GSH (10 mM) at pH 7.4. f. Processed photoacoustic images (3D maximization) of the same sample tubes (1)-(6) in e. g. Quantification of photoacoustic signals of probe 1 (100 μM) in PBS buffer at pH 7.4, probe 1 (100 μM) with GSH (10 mM) at pH 7.4, and probe 2 (100 μM) with GSH (10 mM) at pH 7.4. Standard deviations are shown by error bars.
