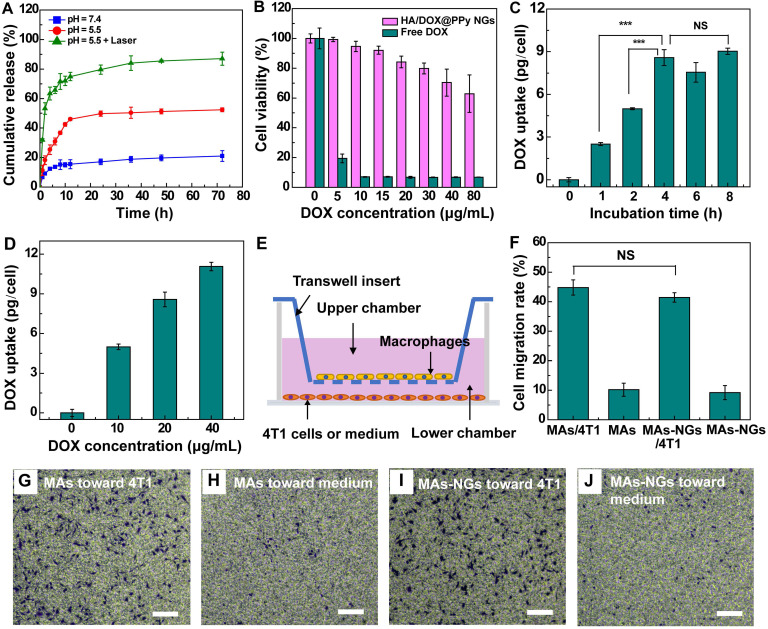
Figure 2.
DOX release from the HA/DOX@PPy NGs at different pHs without or with an 808-nm laser irradiation for 10 min (A). CCK-8 assay of viability of MAs treated with free DOX and HA/DOX@PPy NGs for 24 h at different DOX concentrations (B). Intracellular DOX uptake by MAs after treatment with the HA/DOX@PPy NGs ([DOX] = 20 µg/mL) for different time periods (0, 1, 2, 4, 6 and 8 h, respectively) (C) or incubation with NGs at different DOX concentrations ([DOX] = 0, 10, 20 and 40 µg/mL) for 2 h (D). Schematic illustration of the transmigration assay toward 4T1 cells (E), the statistical migration percentage (F) and the micrographs of the MAs transmigrated to the lower chamber that were stained with crystal violet (G-J). Scale bar for G-J represents 100 µm for each panel. The NS means no significant difference, and ***represents p < 0.001.

