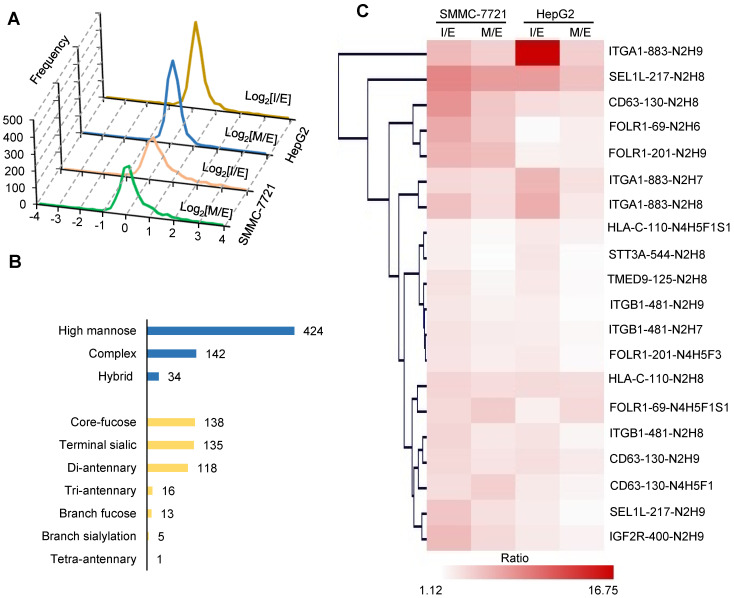
Figure 2.
Quantitative glycoproteomic analysis of two hepatocellular carcinoma cell lines during HGF-induced EMT. A. Distribution of intact glycopeptide alterations at the intermediate (I) and mesenchymal (M) stages of EMT in both cell lines. X axis: log2(I/E ratio) or log2(M/E ratio); Y axis: numbers of intact glycopeptides. B. Classification of quantified intact glycopeptides in both cell lines based on their attached glycan structures. The numbers indicate the unique glycopeptides modified by the corresponding glycans. C. Hierarchical clustering of altered intact glycopeptides (related to Table S4). The label at the right side: protein name-glycosylation site-glycan composition. For example, ITGA1-883-N2H9 means the protein ITGA1 is modified by the glycan N2H9 at the glycosylation site Asn-883. N: HexNAc; H: Hex; F: Fucose; S: Sialic acid. For example, the glycan “N2H9” indicates a high-mannose glycan that contains two HexNAc and nine Hexoses (also known as Man9).

