Figure 5.
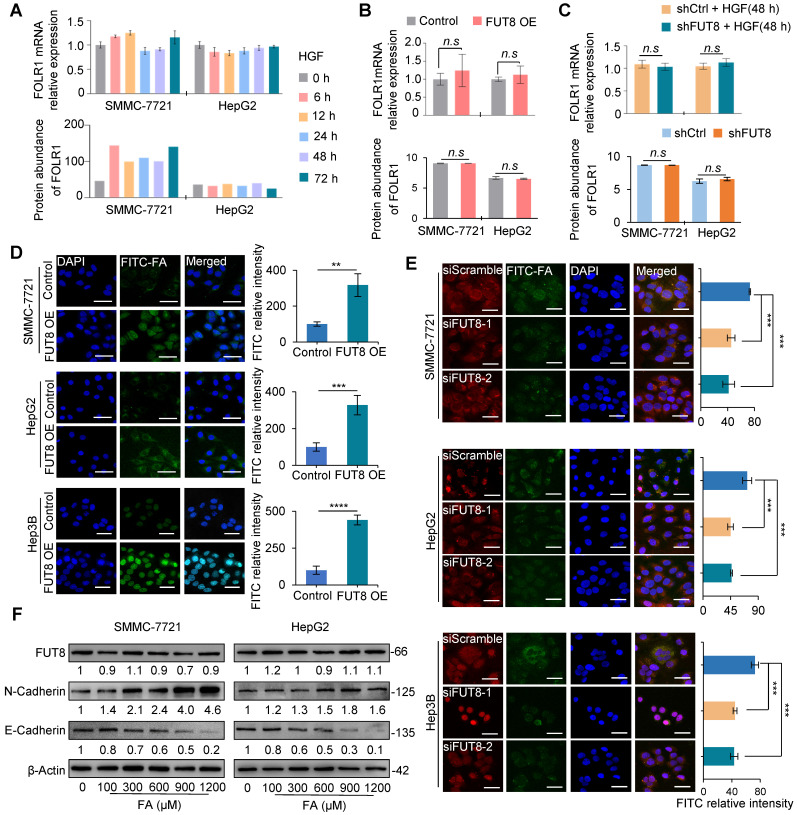
Core-fucosylation on FOLR1 increased uptake capacity of folate. A. The mRNA (upper) and protein (lower) levels of FOLR1 in SMMC-7721 and HepG2 cell lines treated by 10 ng/mL HGF for 72 h. B, C. The mRNA (upper) and protein (lower) levels of FOLR1 in two pairs stable cell lines of (B) FUT8 overexpression or (C) knockdown. The cell lines with FUT8 knockdown were further treated by HGF for 48 h before their FOLR1 mRNA measurement. D. Immunofluorescence staining of FUT8 over-expressed three cell lines treated with 300 µM FITC-FA for 24 h. Scale bar, 30 µm. Relative intensity of FITC-labeled green immunofluorescent was determined by ImageJ software (n=10). E. Immunofluorescence staining of siFUT8-mediated knockdown three cell lines treated with FITC-FA for 24 h. Scale bar, 50 µm. Relative intensity of red and green immunofluorescent was determined by Image-J software (n=10). F. Effects of various concentrations of folate (100~1200 µM) on the protein levels of FUT8, N-cadherin and E-cadherin in SMMC-7721 and HepG2 cells. All qPCR data were generated by averaging triplicate analyses per condition. GAPDH was used as a control. Data are presented as mean ± SEM. P values were determined by two-tailed unpaired t-test in (B-D), or One-way ANOVA was used in (E). n.s, no significance; *P < 0.05, **P < 0.01, ***P < 0.001, ****P < 0.0001.

