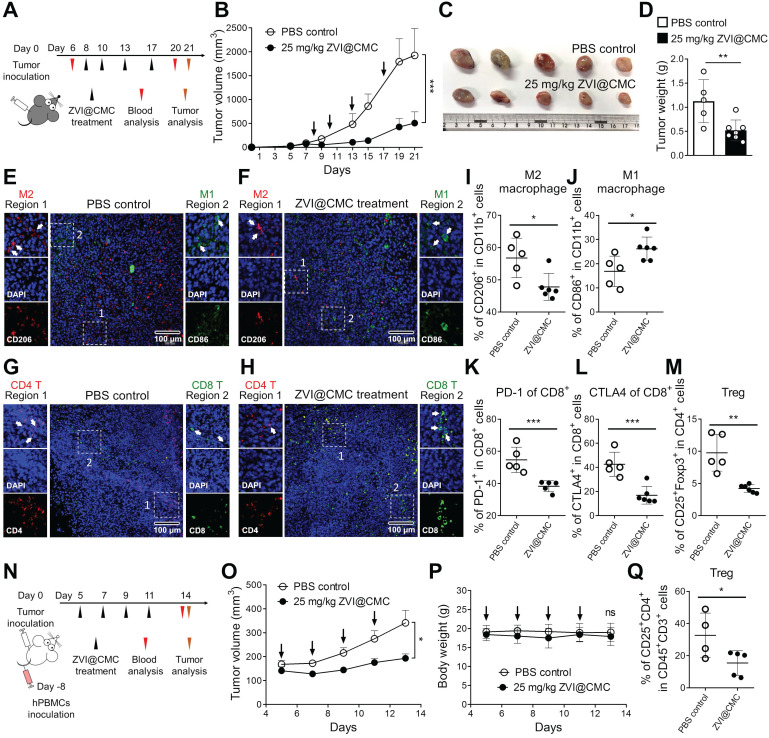
Figure 6.
ZVI-NP treatment inhibited tumor growth and modulated immune cell profile in vivo. A, Schematic illustration of dosing regimens of ZVI@CMC in immunocompetent C57BL/6 mice bearing LLC allografts. C57BL/6 mice were treated with i.v. injection of ZVI@CMC (25 mg/kg) or PBS twice a week as indicated by arrows (n = 5 per group). B, The changes in tumor volume over experimental period. C and D, The representative images of the dissected tumor (C) and the quantification of tumor weight (D) were measured at the endpoint of the experiment. E-H, Immunofluorescent microscopy images of tissue sections were stained with antibodies against mouse CD86 (green) and CD206 (red) for observation of tumor-associated macrophages (E and F) and antibodies against mouse CD8 (green) and CD4 (red) to observe infiltrating T cells (G and H). Scale bar: 100 µm. I-M, Flow cytometry analysis of the tumor-associated macrophages (I and J) and infiltrating T cells (K-M) in endpoint tumors. N, Schematic illustration of dosing regimens of ZVI@CMC in hPBMC reconstituted ASID mice bearing H460 xenografts. Mice were treated with ZVI@CMC (25 mg/kg) or PBS by i.v. injection on every other day as indicated by arrows (n = 5 per group). O and P, The tumor volume (O) and the body weight (P) were measured during experiment. Q, Flow cytometry analysis of Tregs in endpoint tumors. Data were mean ± s.e.m. ns: non-significant; *, p < 0.05; **, p < 0.01; ***, p < 0.001.

