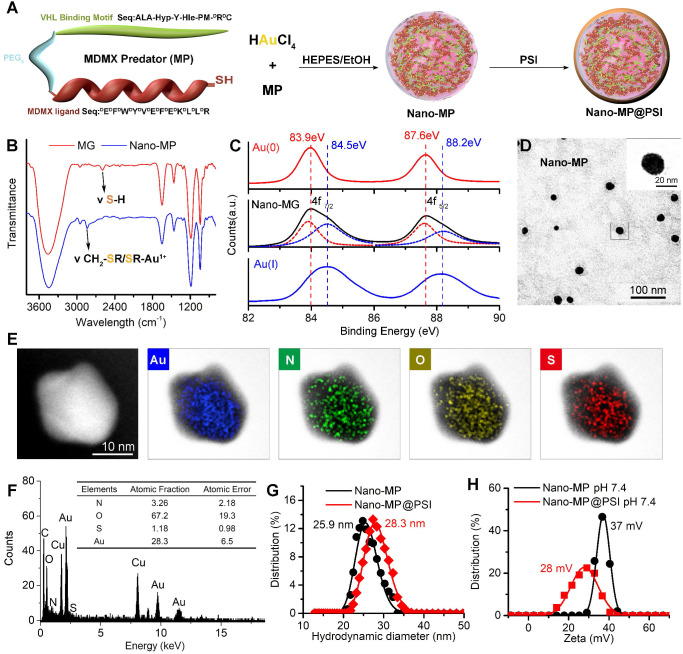
Figure 2.
Design, Synthesis and Characterization of Nano-MP and Nano-MP@PSI. A, schematic diagram of the constructive process of Nano-MP@PSI. B, FTIR spectra. The band at 2650 cm-1 has a red shift to 2800 cm-1 which was attributed to the stretching vibration of -SH. C, Au 4f XPS spectra of Nano-MP (black line), Au(I)-PMI complexes (blue line), and Au(0) nanocrystals (red line). D, TEM images of Nano-MP. E, elemental analysis image of Au, N, O, S overlay with one representative particle of Nano-MP taken by HRTEM. F, EDS quantitative element analysis of Nano-MP. G and H, hydrodynamic diameter distributions (G) and Zeta potential (H) of Nano-MP and Nano-MP@PSI measured in PBS at pH 7.4.

