Figure 3.
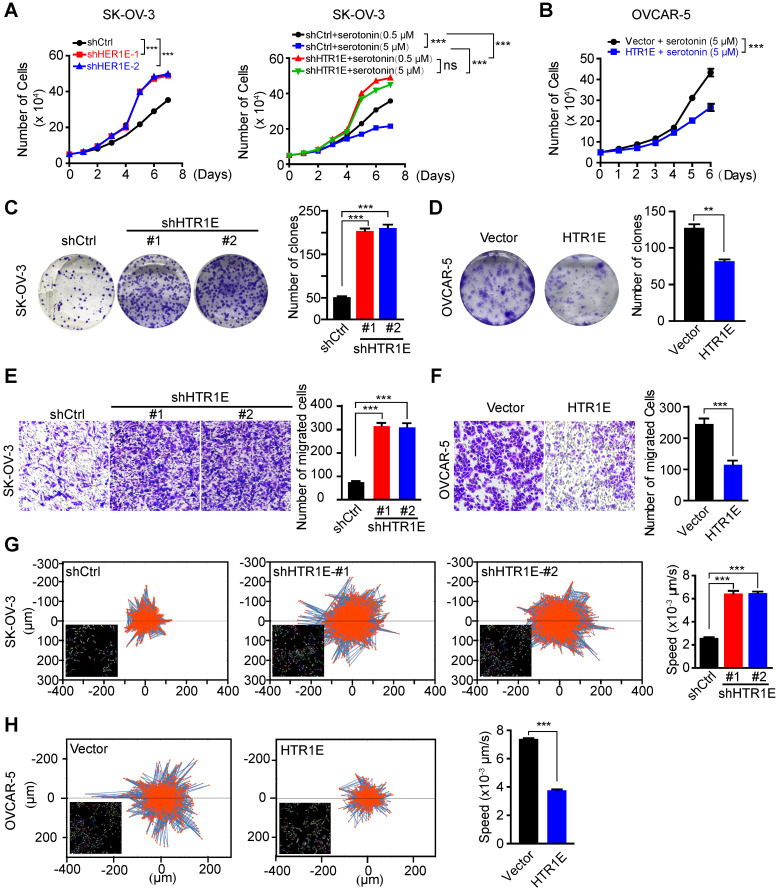
HTR1E inhibits the proliferation and migration of OC cells. (A) The proliferation curves of SK-OV-3 cells transfected with indicated shRNAs in the medium containing basal level of serotonin (0.5 µM) (left) or 5 µM serotonin (right, means ± SEM from three independent experiments, ***P < 0.001, by two-way ANOVA test). (B) Cell proliferation curves of OVCAR5 cells transfected with empty vector (vector) or HTR1E and cultured in the presence of 5 µM serotonin (means ± SEM from three independent experiments; ***P < 0.001, by two-way ANOVA test). (C-D) Colony formation assay of SK-OV-3 (C) and OVCAR-5 (D) cells in the presence of 5 µM serotonin and the quantification. Data are shown as means ± SEM from three independent experiments (**P < 0.01, ***P < 0.001, by unpaired, two-tailed student's t-test). (E-F) Transwell cell migration assay of SK-OV-3 (E) and OVCAR-5 (F) cells in the presence of 5 µM serotonin and the quantification. Data are shown as means ± SEM from three independent experiments (***P < 0.001, by unpaired, two-tailed student's t-test). (G-H) Trajectory of single SK-OV-3 (G) and OVCAR-5 (H) cell cultured in the presence of 5 μM serotonin. The tracked cells of current displacement and average speeds of all cells are shown as means ± SEM from three independent experiments (***P < 0.001, by unpaired, two-tailed student's t-test).

