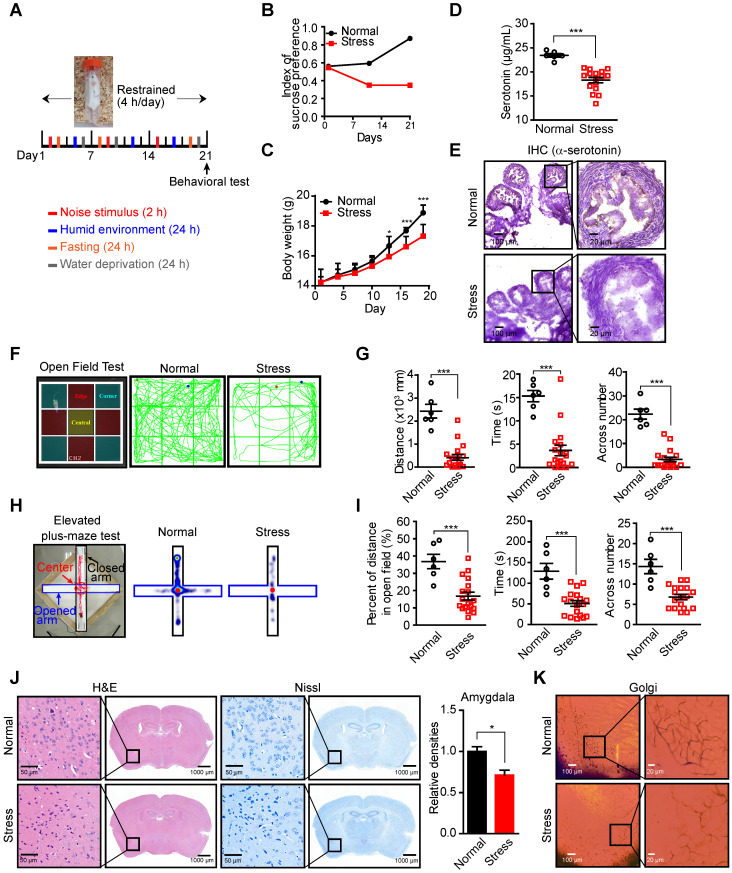
Figure 6.
Decreased serotonin in the peripheral blood serum and ovary of mice in CUMS model. (A) Schematic of the CUMS model. (B-C) Sucrose consumption ratio in the sucrose preference test (B) and body weights (C) (n = 6 in Normal group, n = 18 in Stress group, shown as means ± SEM; *P < 0.05, ***P < 0.001, by unpaired, two-tailed student's t-test). (D) Serum serotonin levels measured by ELISA (n = 6 in Normal group, n = 18 in Stress group, shown as means ± SEM; ***P < 0.001, by unpaired, two-tailed student's t-test). (E) Ovary serotonin levels measured by IHC staining in mice with or without stress stimulation for 21 days. (F) Zoning diagram of open-field test (left) and representative locomotion tracks (green lines) of mice in the normal group and mice under stress (right). (G) The locomotion distance, residence time and the number across center area are compared between mice in the normal group and stress group (shown as means ± SEM; ***P < 0.001, by unpaired, two-tailed student's t-test). (H) Zoning diagram of elevated high-plus maze test (left) and representative locomotion heat map of mice in normal group and stress group (right). (I) The time spent in the open arm area and the number across the center area are compared (shown as means ± SEM; ***P < 0.001, by unpaired, two-tailed student's t-test). (J) H&E and Nissl staining of neuron cells in amygdala of mice in normal and stress groups (left). The quantification of relative densities of neuron cells in amygdala of mice (shown as means ± SEM; *P < 0.05, by unpaired, two-tailed student's t-test). (K) Golgi staining of nerve synapse in amygdala of mice in normal and stress groups.

