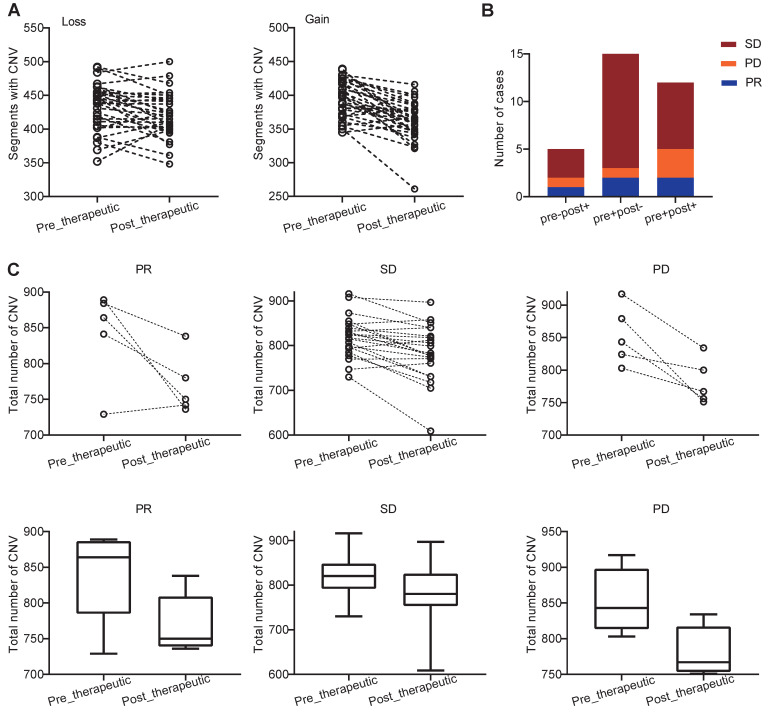
Figure 5.
Distribution and change of CNV in patients with PR, SD, and PD. (A) changes of CNVs before and after chemotherapy of each patients; (B) the number of cases with pre-post-, pre+post+, pre+post-, and pre-post+CNV mutations in the PR, SD, and PD groups (because no patients was classified into pre-post- group, the group was not shown in bar plot); (C) the slope chart and, box and whisker plot for the PR, SD, and PD groups before and after chemotherapy.

