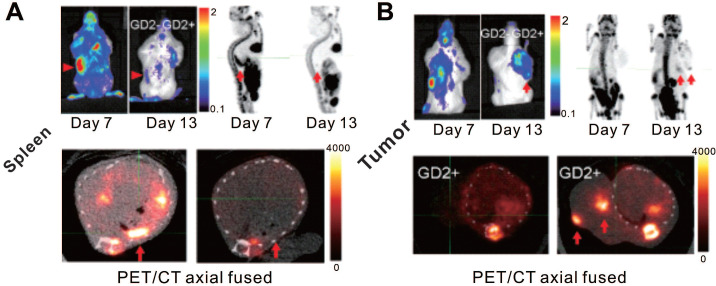
Figure 4.
CAR-T cellular visualization based on eDHFR reporter imaging. After receiving eDHFR-expressing anti-GD2 CAR-T cells, mice bearing both GD2- HCT116 (left shoulder) and GD2+ 143b tumor (right shoulder) were imaged with BLI and 18F-TMP PET for CAR-T cellular visualization. The images showed elevated BLI and PET signal in the spleen on day 7 post T cells infusion (p.t), which decreased on day 13 p.t (A, red arrows). Neither GD2- nor GD2+ tumor displayed BLI or PET signal on day 7 p.t, whereas increased BLI and PET signal was detected only in GD2+ tumor (B, red arrows) on day 13 p.t. Adapted with permission from 84, copyright 2019 The American Society of Gene and Cell Therapy.

