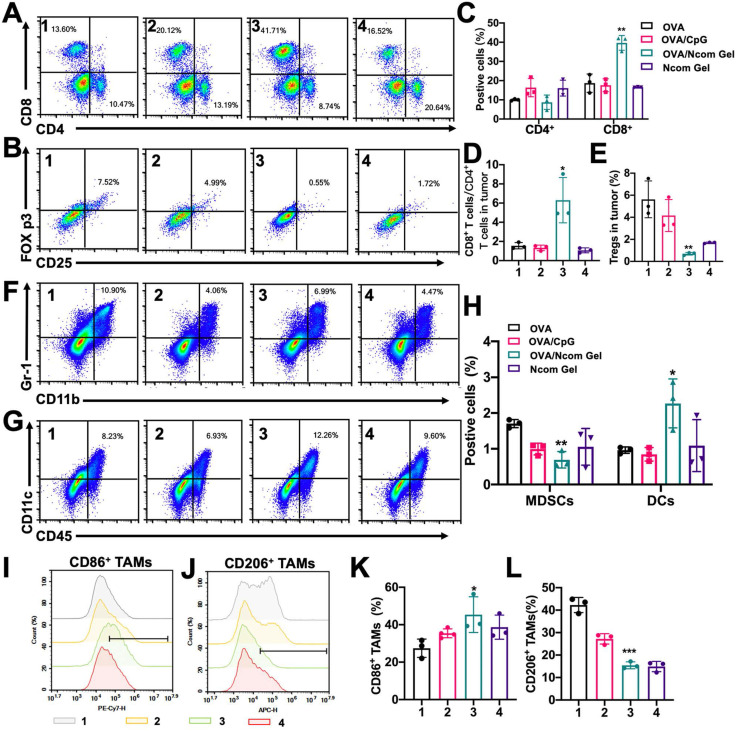
Figure 7.
The Ncom Gel vaccine changes the tumor immune microenvironment through a strong systemic immune response. (A-B) Representative flow cytometry dot plot of tumor infiltrating CD8+ T cells and CD4+ T cells (A) and Tregs (B) 2 days following the last treatment. (C) Quantitative data of CD4+ T cells and CD8+ T cells were analyzed (n=3 biologically independent samples). (D) The ratios of CD8+ T cells to CD4+ T cells in the tumor immune microenvironment (n=3 biologically independent samples). (E) Quantitative data of Tregs were examined (n=3 biologically independent samples). (F-H) The frequencies of MDSCs and DCs in tumors (F) and representative flow cytometry dot plots were analyzed following the last treatment (n=3 biologically independent samples). (I-J) Representative flow cytometry dot histograms of M1 TAMs (CD11b+ F4/80+ CD86+) and M2 TAMs (CD11b+ F4/80+ CD206+) in tumors are shown. (K-L) The frequencies of M1 TAMs and M2 TAMs in tumors examined 2 days after the last treatment (n=3 biologically independent samples). Mice were divided into the following groups: (1) NS, (2) OVA/CpG, (3) OVA/Ncom Gel, and (4) Ncom Gel. All data are represented as means ± s.d. and analyzed with one-way ANOVA with Tukey test. * P < 0.05, **P < 0.01, *** P< 0.001 and **** P< 0.0001.

