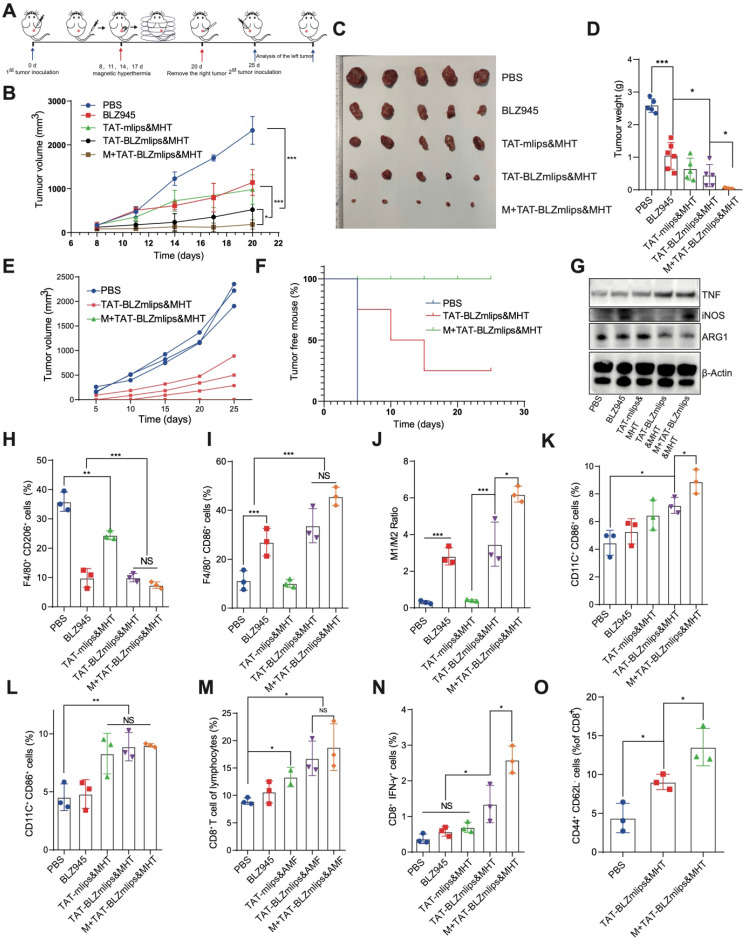
Figure 4.
TAT-BLZmlips mediated mild MHT and CSF1R inhibition in cancer therapy. (A) Schematic illustration of the therapy regimen. (B) The tumor volume curves. Photographs (C) and tumor weight (D) at the end of the first regimen. (E) The tumor volume curve after inoculating the re-challenged tumor cells (n=3 for PBS group, and n =5 for other two groups). (F) Percentage of tumor-free animals (G) Western blotting assay of iNOS, TNF-α, and ARG1 in the tumors after treatment. (H) F4/80+/CD206+ M2Φ subsets in the tumors after treatment. (I) F4/80+/CD86+ M1Φ subsets in the tumors after treatment. (J) The ratio of M1/ M2Φ in the tumors after treatment. (K) CD11C+/CD86+ DC subsets in the lymph nodes after treatment. (L) CD11C+/CD86+ DC subsets in the tumors after treatment. (M) CD8+ T cells subsets in the tumors after treatment. (N) CD8+/IFN-γ+ T cells subsets in the tumors after treatment. (O) Typical flow cytometry plots of effector memory T cells (CD8+ CD44+ CD62L-) in the spleen after tumor re-inoculation. Five mice per group (n = 5).

