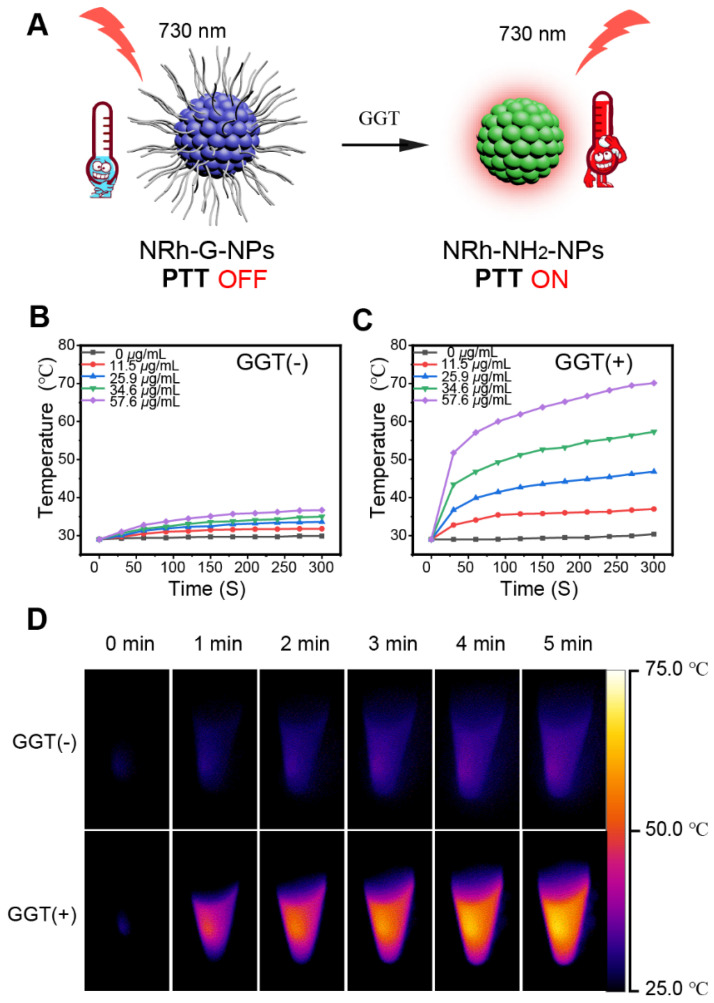
Figure 4.
(A) Schematic diagram of the photothermal property turning on. (B) Temperature curves of different concentrations of NRh-G-NPs (0, 11.5, 25.9, 34.6, 57.6 µg/mL) under exposure to the 730 nm light (1.0 W/cm2) over a period of 5 min. (C) Temperature curves of different concentrations of NRh-G-NPs (0, 11.5, 25.9, 34.6, 57.6 µg/mL) after reacting with GGT (1.0 U/L) under the exposure to 730 nm light (1.0 W/cm2) over a period of 5 min. (D) Infrared thermography of NRh-G-NPs (34.6 µg/mL) without GGT incubation and with GGT incubation.

