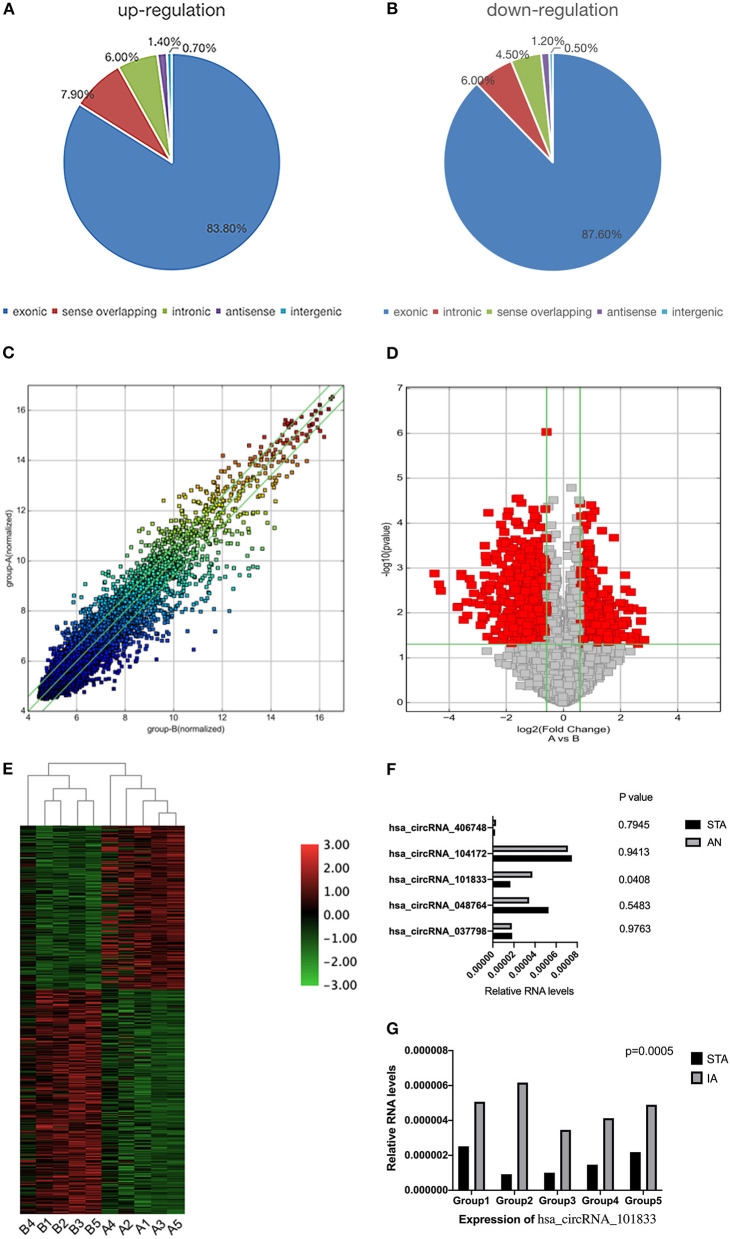
Figure 1.
Differential expression of circRNAs in IA tissues. (A) The constituent of upregulated circRNAs. (B) The constituent of downregulated circRNAs. (C) The scatterplot is used for assessing the circRNA expression variation between the two compared samples or two compared groups of samples. The values of X and Y axes in the scatterplot are the normalized signal values of the samples (log2 scaled) or the averaged normalized signal values of groups of samples (log2 scaled). The green lines are Fold Change Lines. The circRNAs above the top green line and below the bottom green line indicate more than 1.5-fold change of circRNAs between the two compared samples. (D) Volcano Plots are used for visualizing differential expression between two different conditions. The vertical lines correspond to 1.5-fold up and down, respectively, and the horizontal line represents a p-value of 0.05. So the red point in the plot represents the differentially expressed circRNAs with statistical significance. Group A represented STA samples; group B represented IA samples. (E) The hierarchical clustering of differentially expressed circRNAs. “Red” indicates high relative expression, and “green” indicates low relative expression. Group A represented STA samples; group B represented IA samples. (F) Validation of the differential expression of five upregulated circRNAs. (G) Validation of the differential expression of hsa_circRNA_101833 in another five coupled groups. STA, superficial temporal arteries; IA, IA.

