Figure 2.

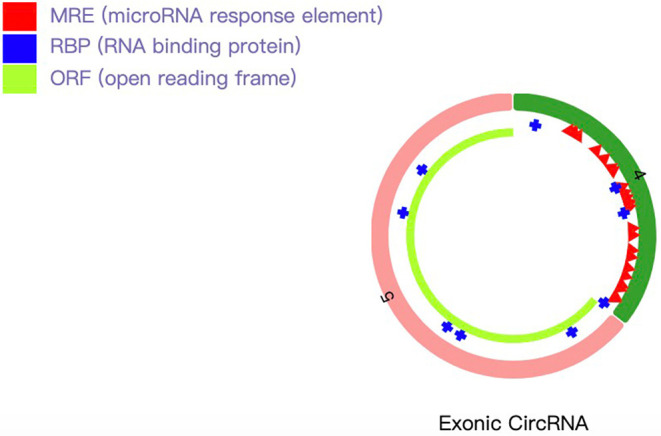
Schematic diagram of hsa_circRNA_101833. The light green bar represents the open reading frame, the blue bar represents proteins binding with hsa_circRNA_101833, and the red bar represents the microRNA binding sites.

Schematic diagram of hsa_circRNA_101833. The light green bar represents the open reading frame, the blue bar represents proteins binding with hsa_circRNA_101833, and the red bar represents the microRNA binding sites.