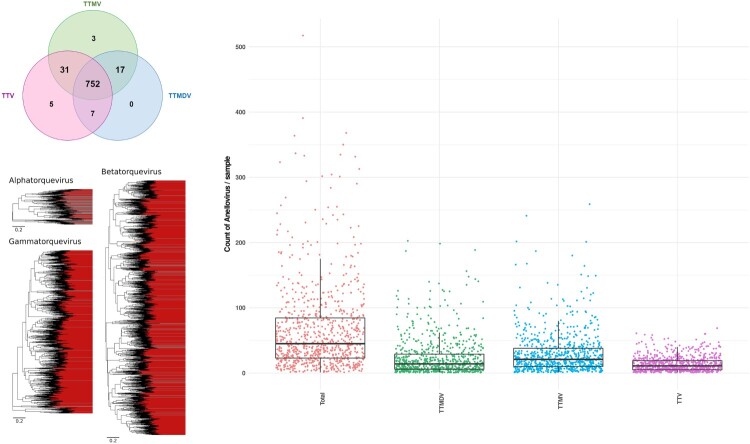
Figure 4.
Representation of Anelloviridae co-detection. (a) Venn plot showing the distribution of Alpha-, Beta- and Gammatorquevirus genus among positive samples. (b) Phylogenetic diversity of primate anellovirus. Alpha-, Beta- and Gammatorquevirus genus are represented by three Maximum Likelihood trees based on complete ORF1 nucleotide sequences. Each branch is a representative sequence of a cluster, each cluster shows at least 20% nucleotide diversity with others. Clusters whose contain previously known complete ORF1 sequences are shaded grey, clusters with only sequences assembled in this study are shaded red. Scale is in number of substitutions per site. (c) Number of distinct anelloviruses of the same genus (i.e. Alpha-, Beta- and Gammatorquevirus) or in total co-detected in each positive sample. The horizontal lines in the box plots denote medians. Each dot represents one sample.

