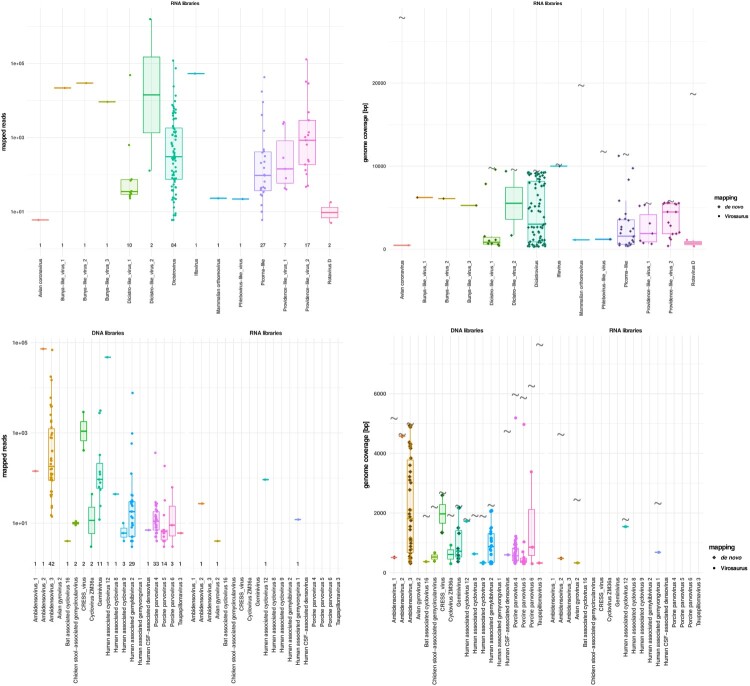
Figure 5.
mNGS metrics for viruses of yet unknown significance. (a) Distribution of the mapped reads for RNA viruses. Each dot represents a positive sample. (b) RNA virus genome coverages. Each dot represents one sample. Viral full genome sizes (bp) are indicated by grey corrugated symbols (except for the segmented bunya-like virus 1–3). Viral sequences detected by de novo only are represented by grey diamonds. (c) Distribution of the mapped reads for DNA viruses detected in DNA (left side) and RNA (right side) libraries. Each dot represents a positive sample. (d) DNA virus genome coverages in DNA (left side) and RNA (right side) libraries. Each dot represents one sample. Viral full genome sizes (bp) are indicated by grey corrugated symbols. The horizontal lines in the box plots denote medians.

