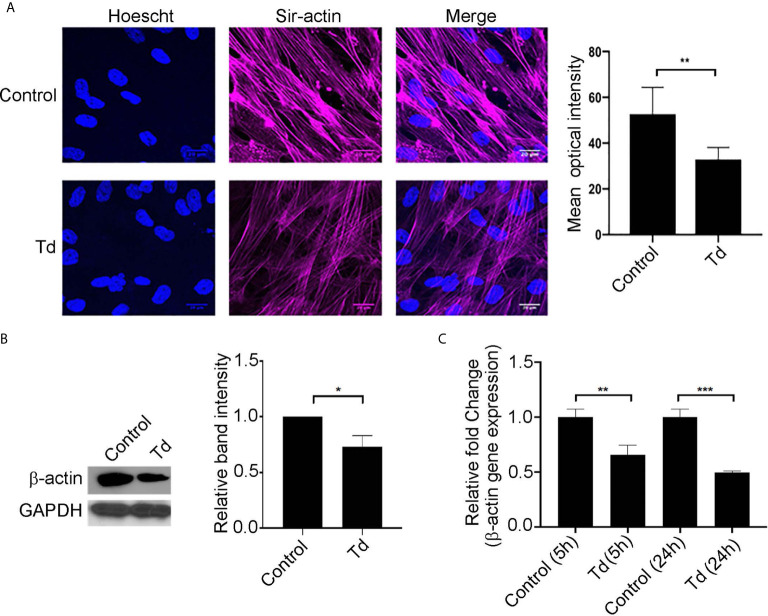
Figure 2.
T. denticola challenge decreases stress fibers and β-actin protein monomer abundance in PDL cells. (A) (Left) PDL cells were unchallenged (control) or challenged with T. denticola (50 MOI) for 24 h and processed for immunofluorescent staining with Hoechst (nucleus, blue) and SiR-Actin probe, and imaged using confocal microscopy. (Right) Relative optical intensities were calculated from three independent experiments. (B) (Left) Representative immunoblot showing β-actin levels in PDL cells challenged with control medium or media containing T. denticola (50 MOI) for 24 h. (Right), Densitometry analysis of three independent experiments was performed using ImageJ software, and the ratio of control samples to T. denticola was calculated. Data represent mean ± SD from three independent experiments. Data were compared using Student’s t-test. * = p<0.05; ** = p<0.01. (C) β-actin gene expression in PDL cells challenged with control medium or media containing T. denticola (50 MOI) for 5h or 24 h by RNA-Seq. The graph shows the fold changes on a log2 scale. Data were compared using Student’s t-test. ** = p<0.01; *** = p<0.001.

