. 2021 Apr 26;12(21):7334–7349. doi: 10.1039/d1sc01739j

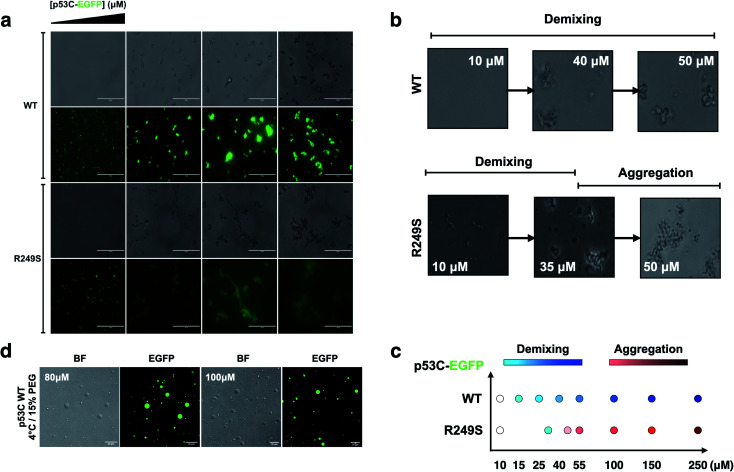
Fig. 2. The DNA-binding domain of p53 undergoes phase separation. (a) Image panel showing bright-field (1st and 3rd row) and fluorescent channel (2nd and 4th row) images obtained at increasing concentrations (10, 55, 140 and 250 μM) of wt and R249S p53C-EGFP in the presence of 15% PEG at 4 °C (scale bar, 50 μm) (incubation time = 3 min). (b) Confocal images showing that the concentration influences the demixing of liquid-like spheroids of wt p53C (HIS-p53C) (10, 40 and 50 μM) and aggregation-like spheroids of the R249S mutant (10, 35 and 50 μM) at 4 °C. (c) Schematic representation of demixing concentrations (10, 15, 25, 40, 55, 100, 150, and 250 μM) of the wt and R249S mutant proteins. (d) Droplets of various concentrations (80 μM and 100 μM) of wt p53C in the presence of 15% w/v PEG at 4 °C detected by DIC microscopy (bright-field) and EGFP; scale bars, 20 μm.

Fig. 2