. 2021 Apr 26;12(21):7334–7349. doi: 10.1039/d1sc01739j

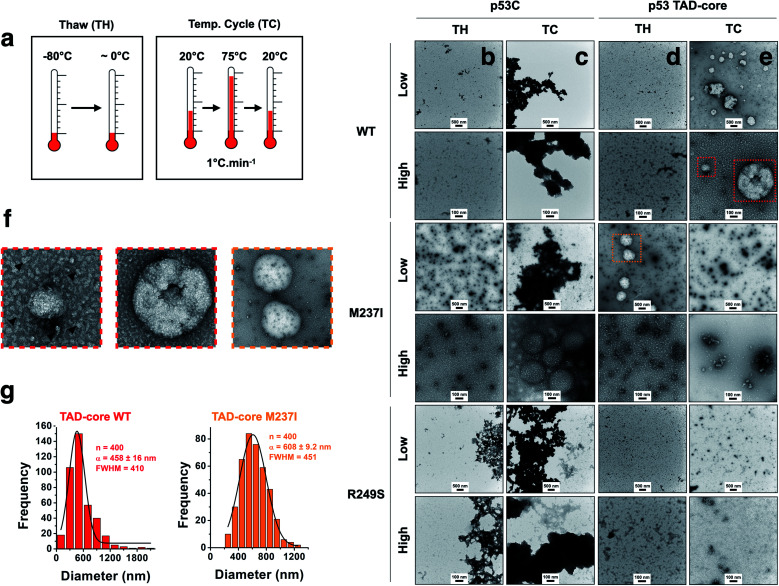
Fig. 4. Influence of intrinsically disordered regions of p53 on the aggregation process. (a) Scheme showing two tested temperature schemes: Thawing (TW) and increase and decrease in temperature (TC). (b–e) Transmission electron micrographs showing the behavior of the wt, M237I and R249S proteins within the context of p53C and p53 TAD-core with respect to solid-like phase transition events at 4 °C (scale bars, 100 and 500 nm). Low and high labels refer to low (scale bar = 500 nm) and high (scale bar = 100 nm) magnification images. (f) Enlarged transmission electron micrographs showing small oligomer-like species (arrowheads). (g) Histogram (bar plots) showing the diameter distribution of droplets of wt and M237I within the context of the p53 TAD-core protein. The data were fitted to a Gaussian distribution (black lines) and show the mean (α) ± s.e.m. of n = 400 measured droplets. FWHM corresponds to full width at half maximum.

Fig. 4