. 2021 Apr 26;12(21):7334–7349. doi: 10.1039/d1sc01739j

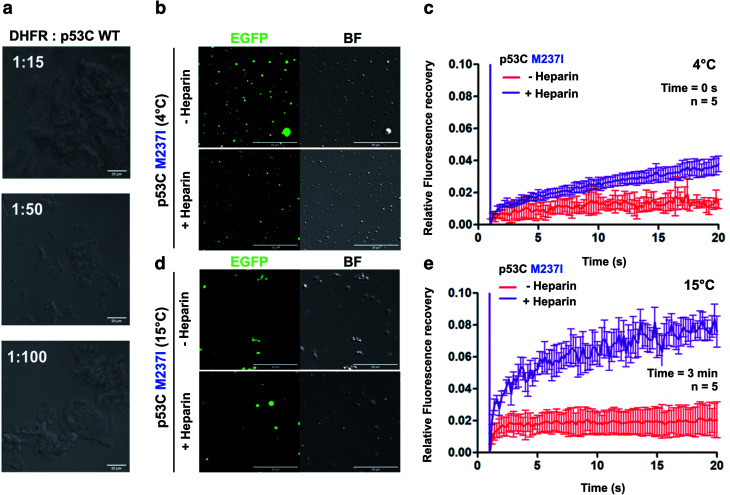
Fig. 7. Polyanions modulate p53C phase separation and transition in vitro. (a) Bright field images at various stoichiometries of DHFR:p53C wt. Scale bar, 20 μm. DHFR corresponds to dihydrofolate reductase. (b and d) Images showing the bright field (BF) and the fluorescence channels of p53C M237I in the absence (−) and in the presence (+) of heparin at (b) 4 °C and (d) 15 °C. Scale bar, 20 μm. (c and e) Line plots showing fluorescence recovery of p53C M237I in the absence (−) and in the presence (+) of heparin at (c) 4 °C and (e) 15 °C. The data are shown as the mean ± s.d. of n = 5 FRAP measurements. Time corresponds to incubation time at indicated temperature before PEG addition.

Fig. 7