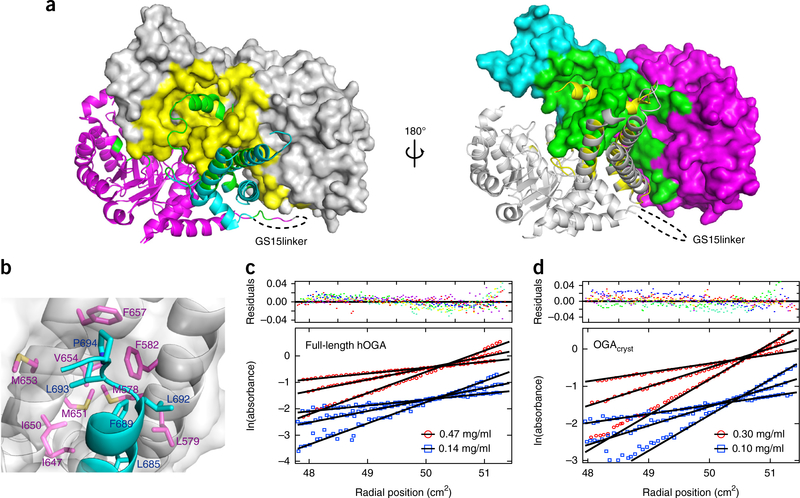
Figure 2.
Dimerization of OGA. (a) Two different views of the dimerization interface in the OGAcryst structure. Left, OGA-α is shown in gray, and OGA-β is shown as a ribbon structure, with the catalytic and stalk domains colored magenta and cyan, respectively. Right, OGA-α is shown in the gray ribbon structure, and OGA-β is shown with the catalytic and stalk domains colored magenta and cyan, respectively. The dimerization interface of OGA-α (yellow) and OGA-β (green) are highlighted. (b) Hydrophobic interactions between the arm region of OGA-β and the nonpolar stalk bundle of OGA-α that contribute to the protein dimerization. OGA-α is shown in surface representation, and the residues involved in the hydrophobic interactions are represented in magenta sticks. OGA-β is shown as a ribbon structure, in which the hydrophobic residues are displayed in cyan sticks. (c) Sedimentation equilibrium results demonstrating that full-length hOGA is a dimer in solution (residuals fit is also shown (top); colors represent residuals for individual data sets). The data presented are the initial loading concentrations of 0.47 mg/ml (red) and 0.14 mg/ml (blue) of full-length hOGA at three different rotor speeds (4,000, 5,600 and 7,600 r.p.m.). (d) Sedimentation equilibrium results demonstrating that OGAcryst is a dimer in solution (residuals fit is also shown (top); colors represent residuals for individual data sets). The data presented are the initial loading concentrations of 0.30 mg/ml (red) and 0.10 mg/ml (blue) of OGAcryst at three different rotor speeds (6,000, 8,800 and 12,000 r.p.m.).

