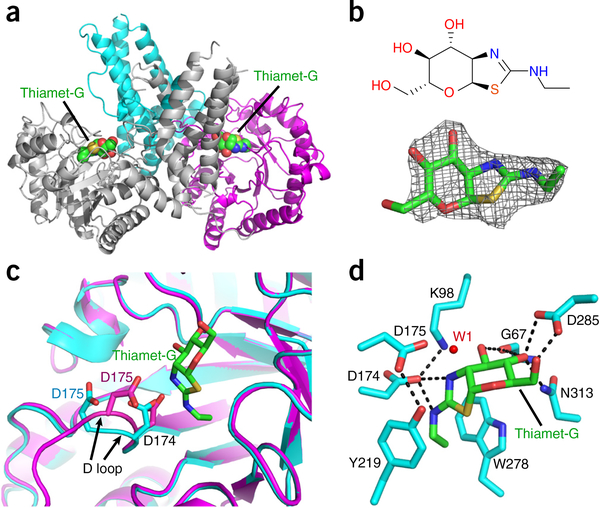
Figure 3.
Structure of OGAcryst in complex with thiamet-G. (a) Ribbon representation of the OGAcryst–thiamet-G complex, in which the thiamet-G molecules are highlighted in spheres. (b) Chemical structure (top) and Fo – Fc density map (contoured at 3σ) (bottom) of thiamet-G. (c) Superposition of OGA-α structures from apo-OGAcryst and the OGAcryst–thiamet-G complex demonstrating the marked movement of the D loop after inhibitor binding. Thiamet-G is shown in green sticks. The catalytic residues (D174 and D175) from apo OGAcryst and OGAcryst–thiamet-G are colored cyan and magenta, respectively. The movement of the D loop is highlighted using black arrows. (d) A close-up view of thiamet-G bound in the active site of OGAcryst. Hydrogen bonds are shown in dashed lines; enzyme residues are shown in cyan sticks; thiamet-G is shown in green sticks; and the catalytic water molecule is displayed as a red dot (W1).

