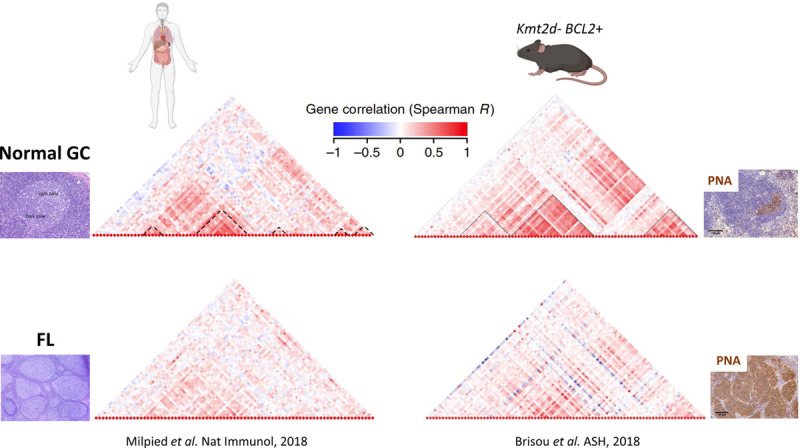
Figure 2.

FL malignant progression is characterized by a progressive desynchronization of a highly coordinated transcriptional program. Dendrograms represent gene correlation computed on single cell quantitative PCR data obtained from normal GC B cells (TOP) and FL cells (DOWN) in human and in a mouse model mimicking loss of Kmt2d and BCL2 overexpression (Kmt2d− BCL2+). The hierarchical clustering is based on gene evolution along the θ GC pseudotime, inferred from the data of thousands of single GC B cells, that model the GC cycle, allowing the identification of clusters of correlated and co-evolving genes characterizing the normal GC reaction; dashed lines at bottom of dendrograms obtained from normal GC B cells demarcate clusters of co-evolving genes during GC reaction.
