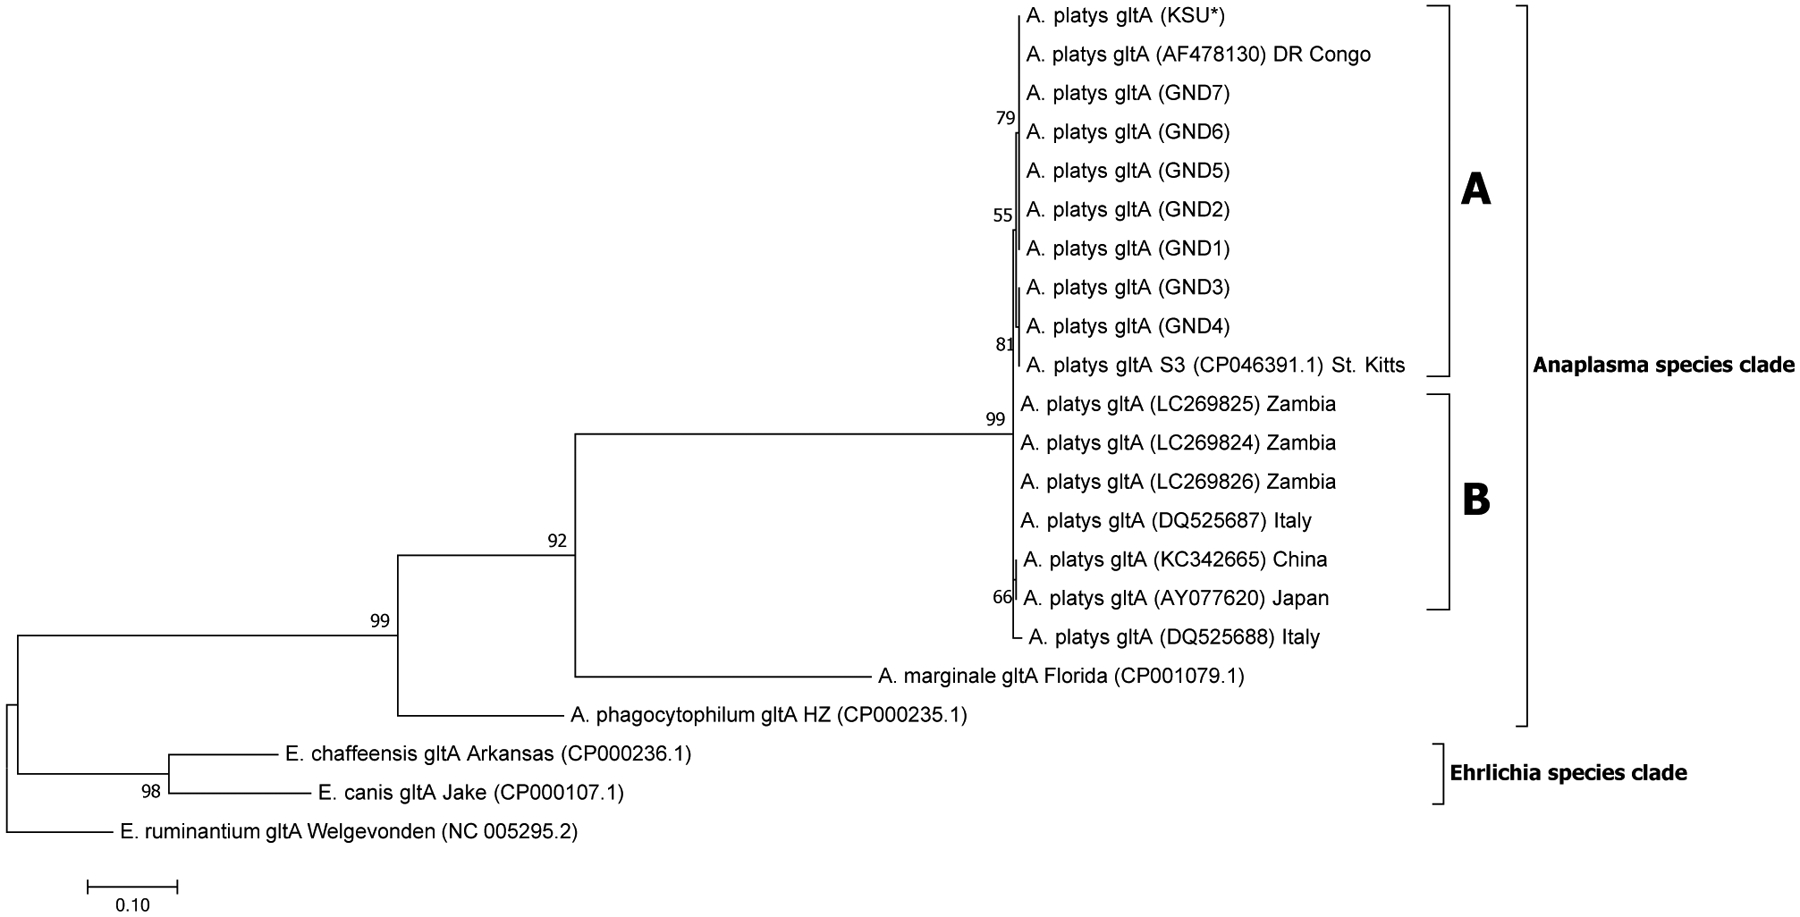
Fig. 3.

Phylogenetic analysis of A. platys gltA gene sequences. Phylogenetic relationships between A. platys and homologous gltA sequences from A. marginale, A. phagocytophilum, E. canis, E. chaffeensis and E. ruminantium were established. Bootstrap values are shown by numbers at each internal node and represent the percentage of 1000 replicates for which the same branching pattern was obtained. There were a total of 1287 positions in the dataset. The analysis was performed as in Fig. 2. For additional details, please refer to Supplementary Fig. 3a and b. A total of 21 nucleotide sequences were used in the final analysis and the scale-bar represents a 10 % nucleotide sequence divergence. Pairwise identity results are included in Supplementary Table 3 and Data 3.
