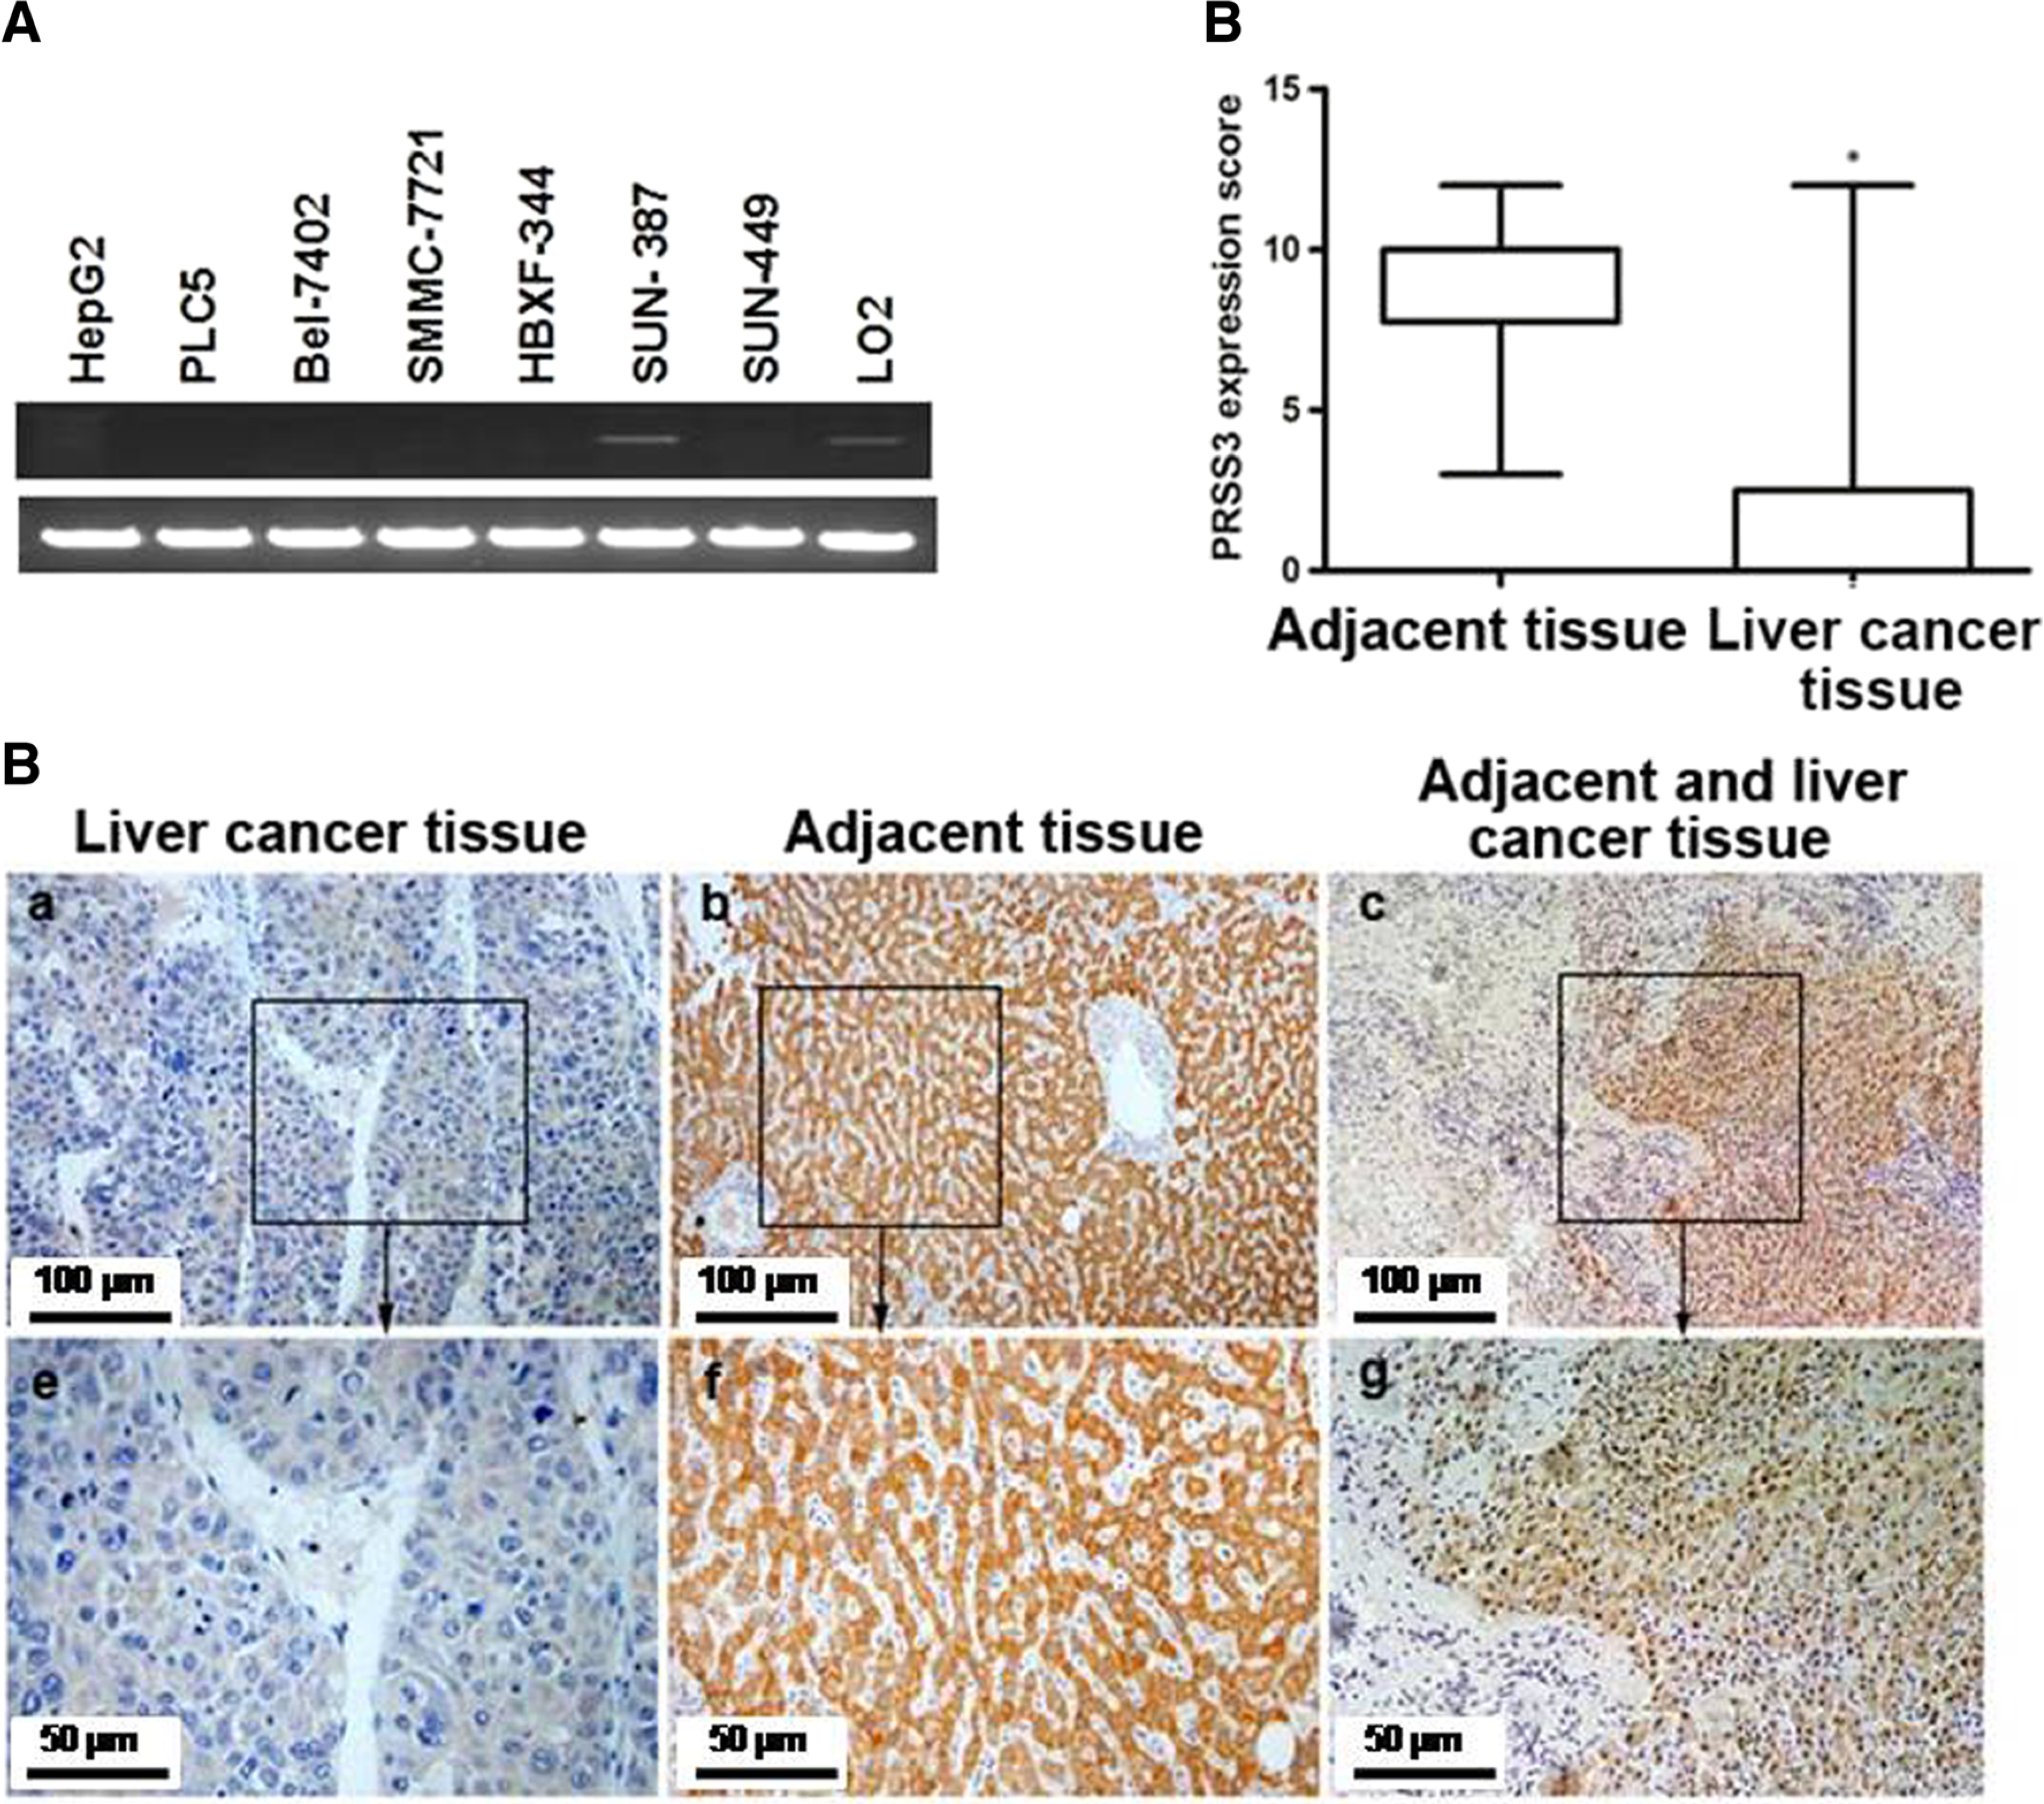
Fig. 1.

PRSS3 expression in human HCC cell lines and tissues. a PRSS3 mRNA expression was analyzed by semi-quantitative RT-PCR using a pair of primers targeting the sequences common to all PRSS3 splicing variants (Supplementary Fig. 1A). The PCR amplicons were shown by agarose gel electrophoresis (the top lane: PRSS3; the bottom lane: GAPDH). b IHC staining for PRSS3 protein expression in tumor and adjacent tissue samples from 25 patients with primary liver cancer. IHC analysis of PRSS3 expression was scored and shown as box plots according to the German semi-quantitative scoring system (see the “Materials and methods” section). The boxes represent the upper and lower quartiles of the data. Vertical bars represent the range of data. *: p < 0.05. c Representative macroscopic images of IHC staining of PRSS3 expression in tumor tissue (a, e), adjacent tissue (b, f), and the junction between tumor and adjacent tissue (c, g). a–c The images with × 200 magnification. e–g The images with × 400 magnification from boxed regions in the a–c, respectively
