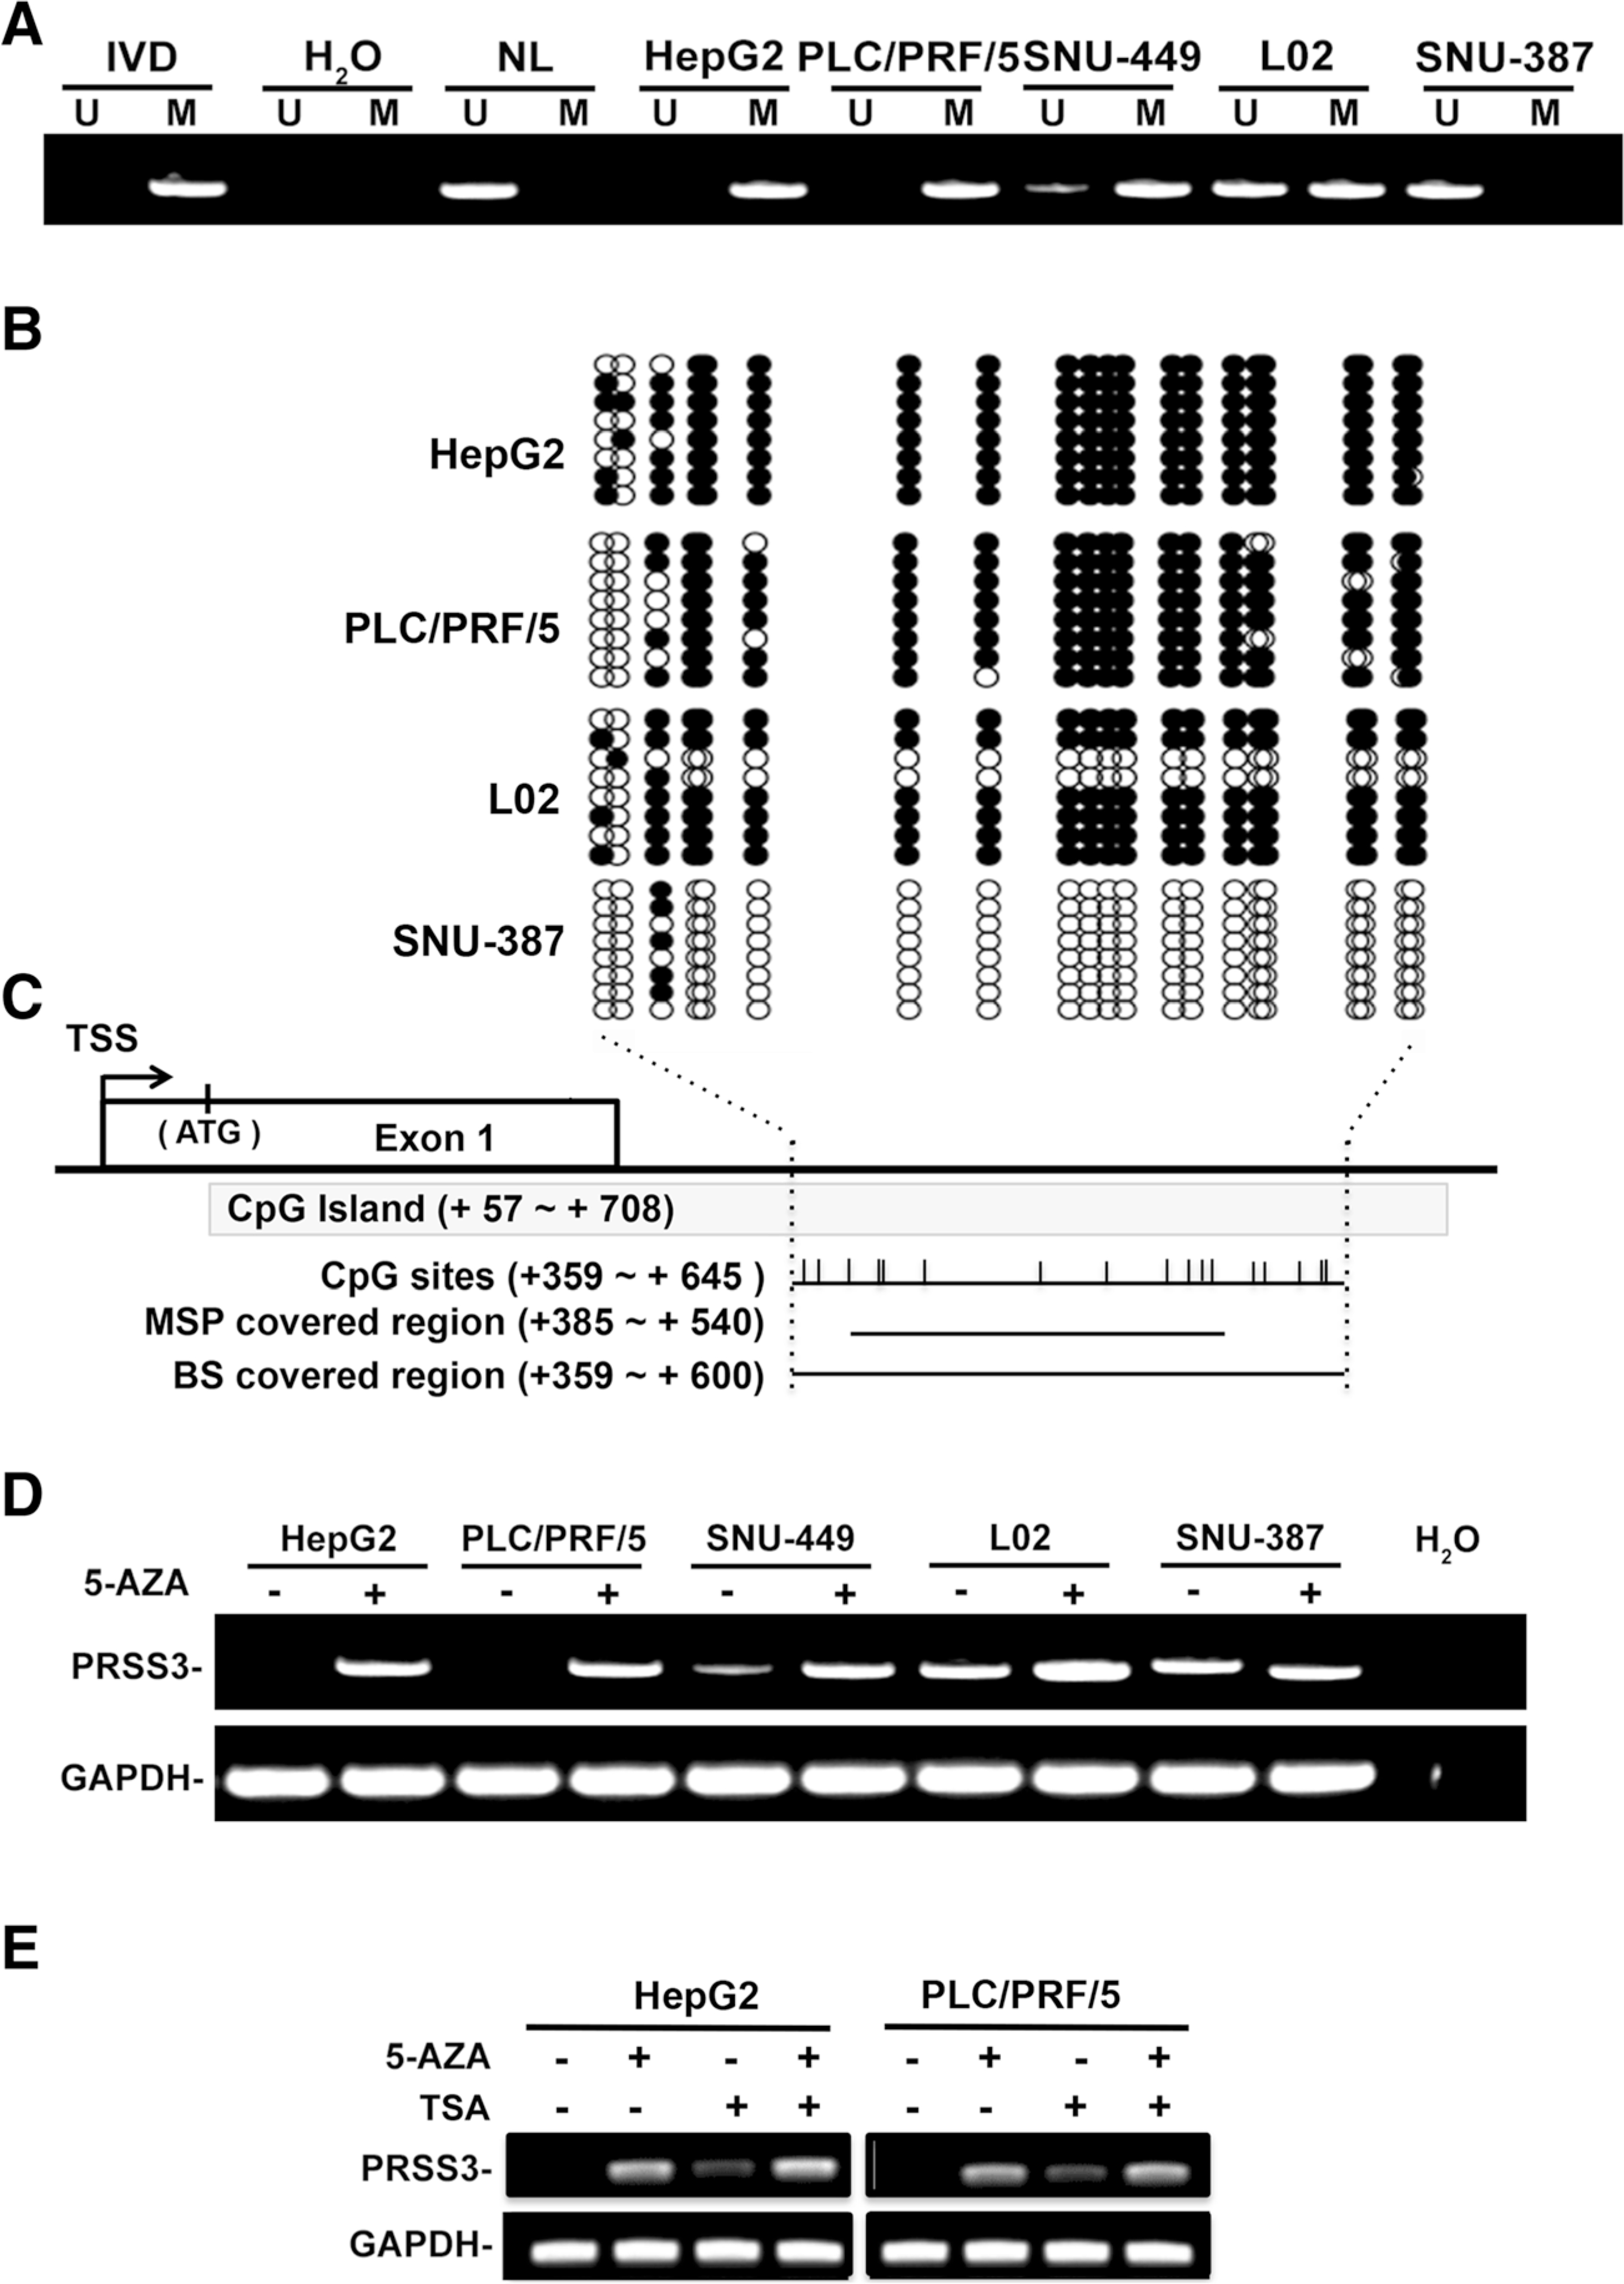
Fig. 2.

Intragenic DNA methylation status of PRSS3 gene in HCC cells. a The intragenic DNA methylation status of PRSS3 in HCC cell lines was analyzed by MSP. The MSP primers covered region shown as c in below. U: unmethylated; M: methylated; IVD: in vitro methylated DNA served as MSP positive control; NL: normal blood lymphocyte DNA as negative control; MSP: methylation-specific PCR; BS: bisulfite sequencing. b BS analysis of PRSS3 intragenic methylation. The sequencing results were aligned as rows in the grid. Each row represents a sequencing result of the PRSS3 intragenic CpG methylation status from an individual allele of one colony. Circles represent CpG sites, with black as methylated ones and white as unmethylated ones. c The schematic diagram of the intragenic region closed to the first exon of PRSS3 gene encoding for TYR4.The CpG island (+ 57 ~ + 708 from the transcription start site) is shown in gray box, in which MSP and BS covered regions are shown as black lines. Vertical bars represent CpG sites in the intragenic region examined by BS and MSP assays as indicated. TSS: transcription start site. d PRSS3 expression in human HCC cells after treatment with 5-AZA. e PRSS3 expression in human HCC cells after treatment with AZA and/or TSA treatment. 5-AZA: 5-aza-2′-deoxycytidine; TSA: trichostatin A; GAPDH: the internal control of RT-PCR
