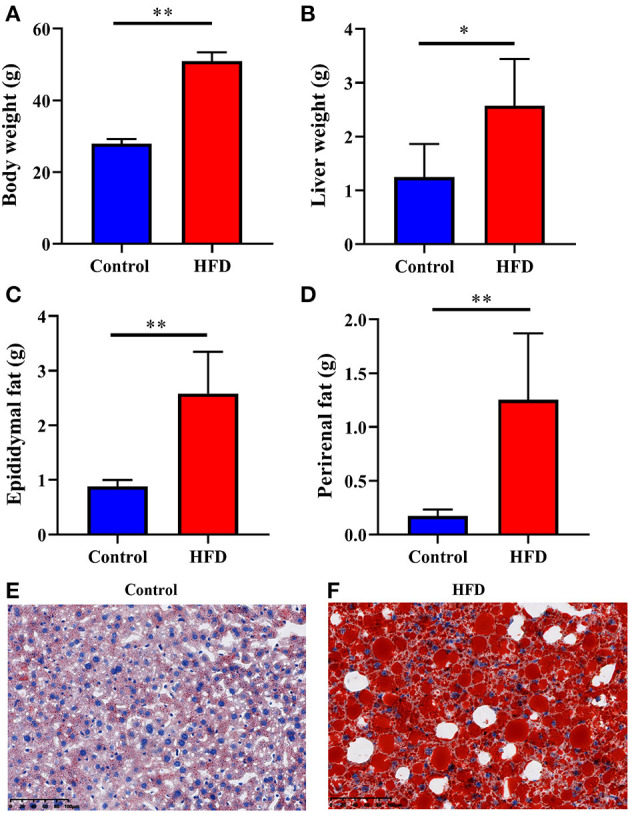
Figure 1.

Characterization of the obesity induced by HFD. The Control and HFD groups mice were analyzed for body weight (A), liver weight (B), epididymal fat weight (C), perirenal fat weight (D). Oil-red O stains of paraformaldehyde-fixed liver sections prepared from the Control (E) and HFD (F) group mice. Data were expressed as mean ± SEM and statistically analyzed by using unpaired two-tailed Students’ t-test (n = 5). Asterisks (* and **) represent significant differences with P < 0.05 and P < 0.01, respectively.
